Various V8 optimization guidelines recommend passing --js-flags="--trace-opt --trace-deopt" and similar flags to Chrome to investigate performance problems with your JavaScript. However people trying this on Windows can’t see any output and are unable to redirect stdout via conventional >. Here is a small hacky Python script I use to battle this problem:
import mmap
import ctypes
GUI = 2
CUI = 3
# Take chrome.exe from the current directory
with open("chrome.exe", "r+b") as f:
map = mmap.mmap(f.fileno(), 1024, None, mmap.ACCESS_WRITE)
# DWORD field of IMAGE_DOS_HEADER
e_lfanew = (ctypes.c_ulong.from_buffer(map, 30 * 2).value)
# Signature (4 bytes), IMAGE_FILE_HEADER (20 bytes), offset to Subsystem field in IMAGE_OPTIONAL_HEADER
subsystem = ctypes.c_ushort.from_buffer(map, e_lfanew + 4 + 20 + (17 * 4))
if subsystem.value == GUI:
subsystem.value = CUI
print "patched: gui -> cui"
elif subsystem.value == CUI:
subsystem.value = GUI
print "patched: cui -> gui"
else:
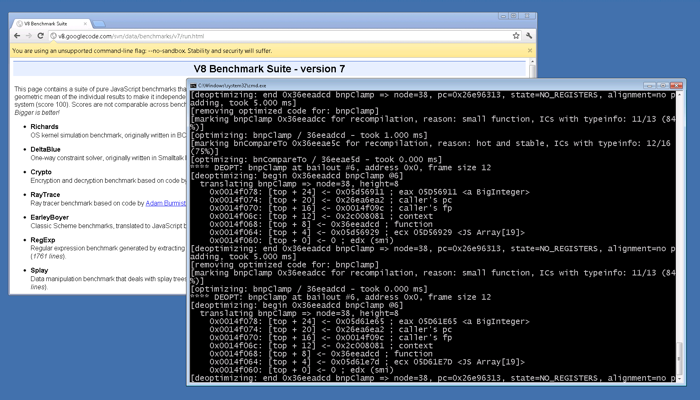
print "unknown subsystem: %x" % (subsystem.value)Run it in a directory containing chrome.exe and script will patch the executable: flipping Subsystem field in IMAGE_OPTIONAL_HEADER from IMAGE_SUBSYSTEM_WINDOWS_GUI to IMAGE_SUBSYSTEM_WINDOWS_CUI (and back if you run it again). When you run patched chrome.exe Windows will attach console to it so that you can see (and redirect) what Chrome writes to stdout/stderr. For example to see a trace of optimized functions, failed optimization attempts and deoptimizations run Chrome like this:
chrome.exe --no-sandbox --js-flags="--trace-opt --trace-bailout --trace-deopt"
[`--no-sandbox` is apparently required to allow renderers to write to a shared console. But don't browse around with this flag :-)]
Want to discuss
contents of this post? Drop me a mail [email protected] or find me on
Mastodon,
X or Bluesky.