Few weeks ago I noticed a blog post “Oxidizing Source Maps with Rust and WebAssembly”
making rounds on Twitter - talking about performance benefits of replacing
plain JavaScript in the core of source-map library with a Rust version
compiled to WebAssembly.
This post piqued my interest, not because I am a huge on either Rust or WASM, but rather because I am always curious about language features and optimizations missing in pure JavaScript to achieve similar performance characteristics.
So I checked out the library from GitHub and departed on a small performance investigation, which I am documenting here almost verbatim.
- Getting the Code
- Profiling the Pure-JavaScript Version
- Optimizing Sorting - Argument Adaptation
- Optimizing Sorting - Monomorphisation
- Optimizing Parsing - Removing Segment Cache
- Optimizing Sorting - Algorithmic Improvements
- Optimizing Parsing - Reducing GC Pressure
- Optimizing Parsing - Using
Uint8ArrayInstead of a String. - Total Improvements Against the Baseline
- Comparing to Oxidized
source-mapVersion - Learnings
- Afterword
Getting the Code
For my investigations I was using an almost default x64.release build of the V8 at commit 69abb960c97606df99408e6869d66e014aa0fb51 from January 20th. My only departure from the default configuration is that I enable disassembler via GN flags to be able to dive down to generated machine code if needed.
╭─ ~/src/v8/v8 ‹master›
╰─$ gn args out.gn/x64.release --list --short --overrides-only
is_debug = false
target_cpu = "x64"
use_goma = true
v8_enable_disassembler = true
Then I got a checkouts of source-map package at:
- commit c97d38b, which was the last commit that updated
dist/source-map.jsbefore Rust/WASM started landed; - commit 51cf770 which was the most recent commit, when I did my investigation;
Profiling the Pure-JavaScript Version
Running benchmark in the pure-JS version was simple:
╭─ ~/src/source-map/bench ‹ c97d38b›
╰─$ d8 bench-shell-bindings.js
Parsing source map
console.timeEnd: iteration, 4655.638000
console.timeEnd: iteration, 4751.122000
console.timeEnd: iteration, 4820.566000
console.timeEnd: iteration, 4996.942000
console.timeEnd: iteration, 4644.619000
[Stats samples: 5, total: 23868 ms, mean: 4773.6 ms, stddev: 161.22112144505135 ms]
The first thing that I did was to disable the serialization part of the benchmark:
diff --git a/bench/bench-shell-bindings.js b/bench/bench-shell-bindings.js
index 811df40..c97d38b 100644
--- a/bench/bench-shell-bindings.js
+++ b/bench/bench-shell-bindings.js
@@ -19,5 +19,5 @@ load("./bench.js");
 print("Parsing source map");
 print(benchmarkParseSourceMap());
 print();
-print("Serializing source map");
-print(benchmarkSerializeSourceMap());
+// print("Serializing source map");
+// print(benchmarkSerializeSourceMap());
And then threw it into the Linux perf profiler:
╭─ ~/src/source-map/bench ‹perf-work›
╰─$ perf record -g d8 --perf-basic-prof bench-shell-bindings.js
Parsing source map
console.timeEnd: iteration, 4984.464000
^C[ perf record: Woken up 90 times to write data ]
[ perf record: Captured and wrote 24.659 MB perf.data (~1077375 samples) ]
Notice that I am passing --perf-basic-prof flag to the d8 binary which
instructs V8 to generate an auxiliary mappings file /tmp/perf-$pid.map. This
file allows perf report to understand JIT generated machine code.
Here is what we get from perf report --no-children after zooming on
the main execution thread:
Overhead  Symbol
  17.02%  *doQuickSort ../dist/source-map.js:2752
  11.20%  Builtin:ArgumentsAdaptorTrampoline
   7.17%  *compareByOriginalPositions ../dist/source-map.js:1024
   4.49%  Builtin:CallFunction_ReceiverIsNullOrUndefined
   3.58%  *compareByGeneratedPositionsDeflated ../dist/source-map.js:1063
   2.73%  *SourceMapConsumer_parseMappings ../dist/source-map.js:1894
   2.11%  Builtin:StringEqual
   1.93%  *SourceMapConsumer_parseMappings ../dist/source-map.js:1894
   1.66%  *doQuickSort ../dist/source-map.js:2752
   1.25%  v8::internal::StringTable::LookupStringIfExists_NoAllocate
   1.22%  *SourceMapConsumer_parseMappings ../dist/source-map.js:1894
   1.21%  Builtin:StringCharAt
   1.16%  Builtin:Call_ReceiverIsNullOrUndefined
   1.14%  v8::internal::(anonymous namespace)::StringTableNoAllocateKey::IsMatch
   0.90%  Builtin:StringPrototypeSlice
   0.86%  Builtin:KeyedLoadIC_Megamorphic
   0.82%  v8::internal::(anonymous namespace)::MakeStringThin
   0.80%  v8::internal::(anonymous namespace)::CopyObjectToObjectElements
   0.76%  v8::internal::Scavenger::ScavengeObject
   0.72%  v8::internal::String::VisitFlat<v8::internal::IteratingStringHasher>
   0.68%  *SourceMapConsumer_parseMappings ../dist/source-map.js:1894
   0.64%  *doQuickSort ../dist/source-map.js:2752
   0.56%  v8::internal::IncrementalMarking::RecordWriteSlow
Indeed, just like the “Oxidizing Source Maps …” post has stated the benchmark
is rather heavy on sort: doQuickSort appears at the top of the profile and
also several times down the list (which means that it was optimized/deoptimized
few times).
Optimizing Sorting - Argument Adaptation
One thing that jumps out in the profiler are suspicious entries,
namely Builtin:ArgumentsAdaptorTrampoline and Builtin:CallFunction_ReceiverIsNullOrUndefined
which seem to be part of the V8 implementation. If we ask perf report to expand
call chains leading to them then we will notice that these functions are also
mostly invoked from the sorting code:
- Builtin:ArgumentsAdaptorTrampoline
  + 96.87% *doQuickSort ../dist/source-map.js:2752
  +  1.22% *SourceMapConsumer_parseMappings ../dist/source-map.js:1894
  +  0.68% *SourceMapConsumer_parseMappings ../dist/source-map.js:1894
  +  0.68% Builtin:InterpreterEntryTrampoline
  +  0.55% *doQuickSort ../dist/source-map.js:2752

- Builtin:CallFunction_ReceiverIsNullOrUndefined
  + 93.88% *doQuickSort ../dist/source-map.js:2752
  +  2.24% *SourceMapConsumer_parseMappings ../dist/source-map.js:1894
  +  2.01% Builtin:InterpreterEntryTrampoline
  +  1.49% *SourceMapConsumer_parseMappings ../dist/source-map.js:1894
It is time to look at the code. Quicksort implementation itself lives in lib/quick-sort.js and
it is invoked from parsing code in lib/source-map-consumer.js.
Comparison functions used for sorting are compareByGeneratedPositionsDeflated and compareByOriginalPositions.
Looking at the definitions of these comparison functions and how they are invoked from quick-sort implementation reveals that the invocation site has mismatching arity:
function compareByOriginalPositions(mappingA, mappingB, onlyCompareOriginal) {
  // ...
}

function compareByGeneratedPositionsDeflated(mappingA, mappingB, onlyCompareGenerated) {
  // ...
}

function doQuickSort(ary, comparator, p, r) {
  // ...
      if (comparator(ary[j], pivot) <= 0) {
        // ...
      }
  // ...
}
Grepping through library sources reveals that outside of tests quickSort is
only ever called with these two functions.
What if we fix the invocation arity?
diff --git a/dist/source-map.js b/dist/source-map.js
index ade5bb2..2d39b28 100644
--- a/dist/source-map.js
+++ b/dist/source-map.js
@@ -2779,7 +2779,7 @@ return /******/ (function(modules) { // webpackBootstrap
            //
            //   * Every element in `ary[i+1 .. j-1]` is greater than the pivot.
            for (var j = p; j < r; j++) {
-             if (comparator(ary[j], pivot) <= 0) {
+             if (comparator(ary[j], pivot, false) <= 0) {
                i += 1;
                swap(ary, i, j);
              }
[Note: I am doing edits directly in dist/source-map.js because I did not
want to spend time figuring out the build process]
╭─ ~/src/source-map/bench ‹perf-work› [Fix comparator invocation arity]
╰─$ d8 bench-shell-bindings.js
Parsing source map
console.timeEnd: iteration, 4037.084000
console.timeEnd: iteration, 4249.258000
console.timeEnd: iteration, 4241.165000
console.timeEnd: iteration, 3936.664000
console.timeEnd: iteration, 4131.844000
console.timeEnd: iteration, 4140.963000
[Stats samples: 6, total: 24737 ms, mean: 4122.833333333333 ms, stddev: 132.18789657150916 ms]
Just by fixing the arity mismatch we improved benchmark mean on V8 by 14% from
4774 ms to 4123 ms. If we profile the benchmark again we will discover that
ArgumentsAdaptorTrampoline has completely disappeared from it. Why was it
there in the first place?
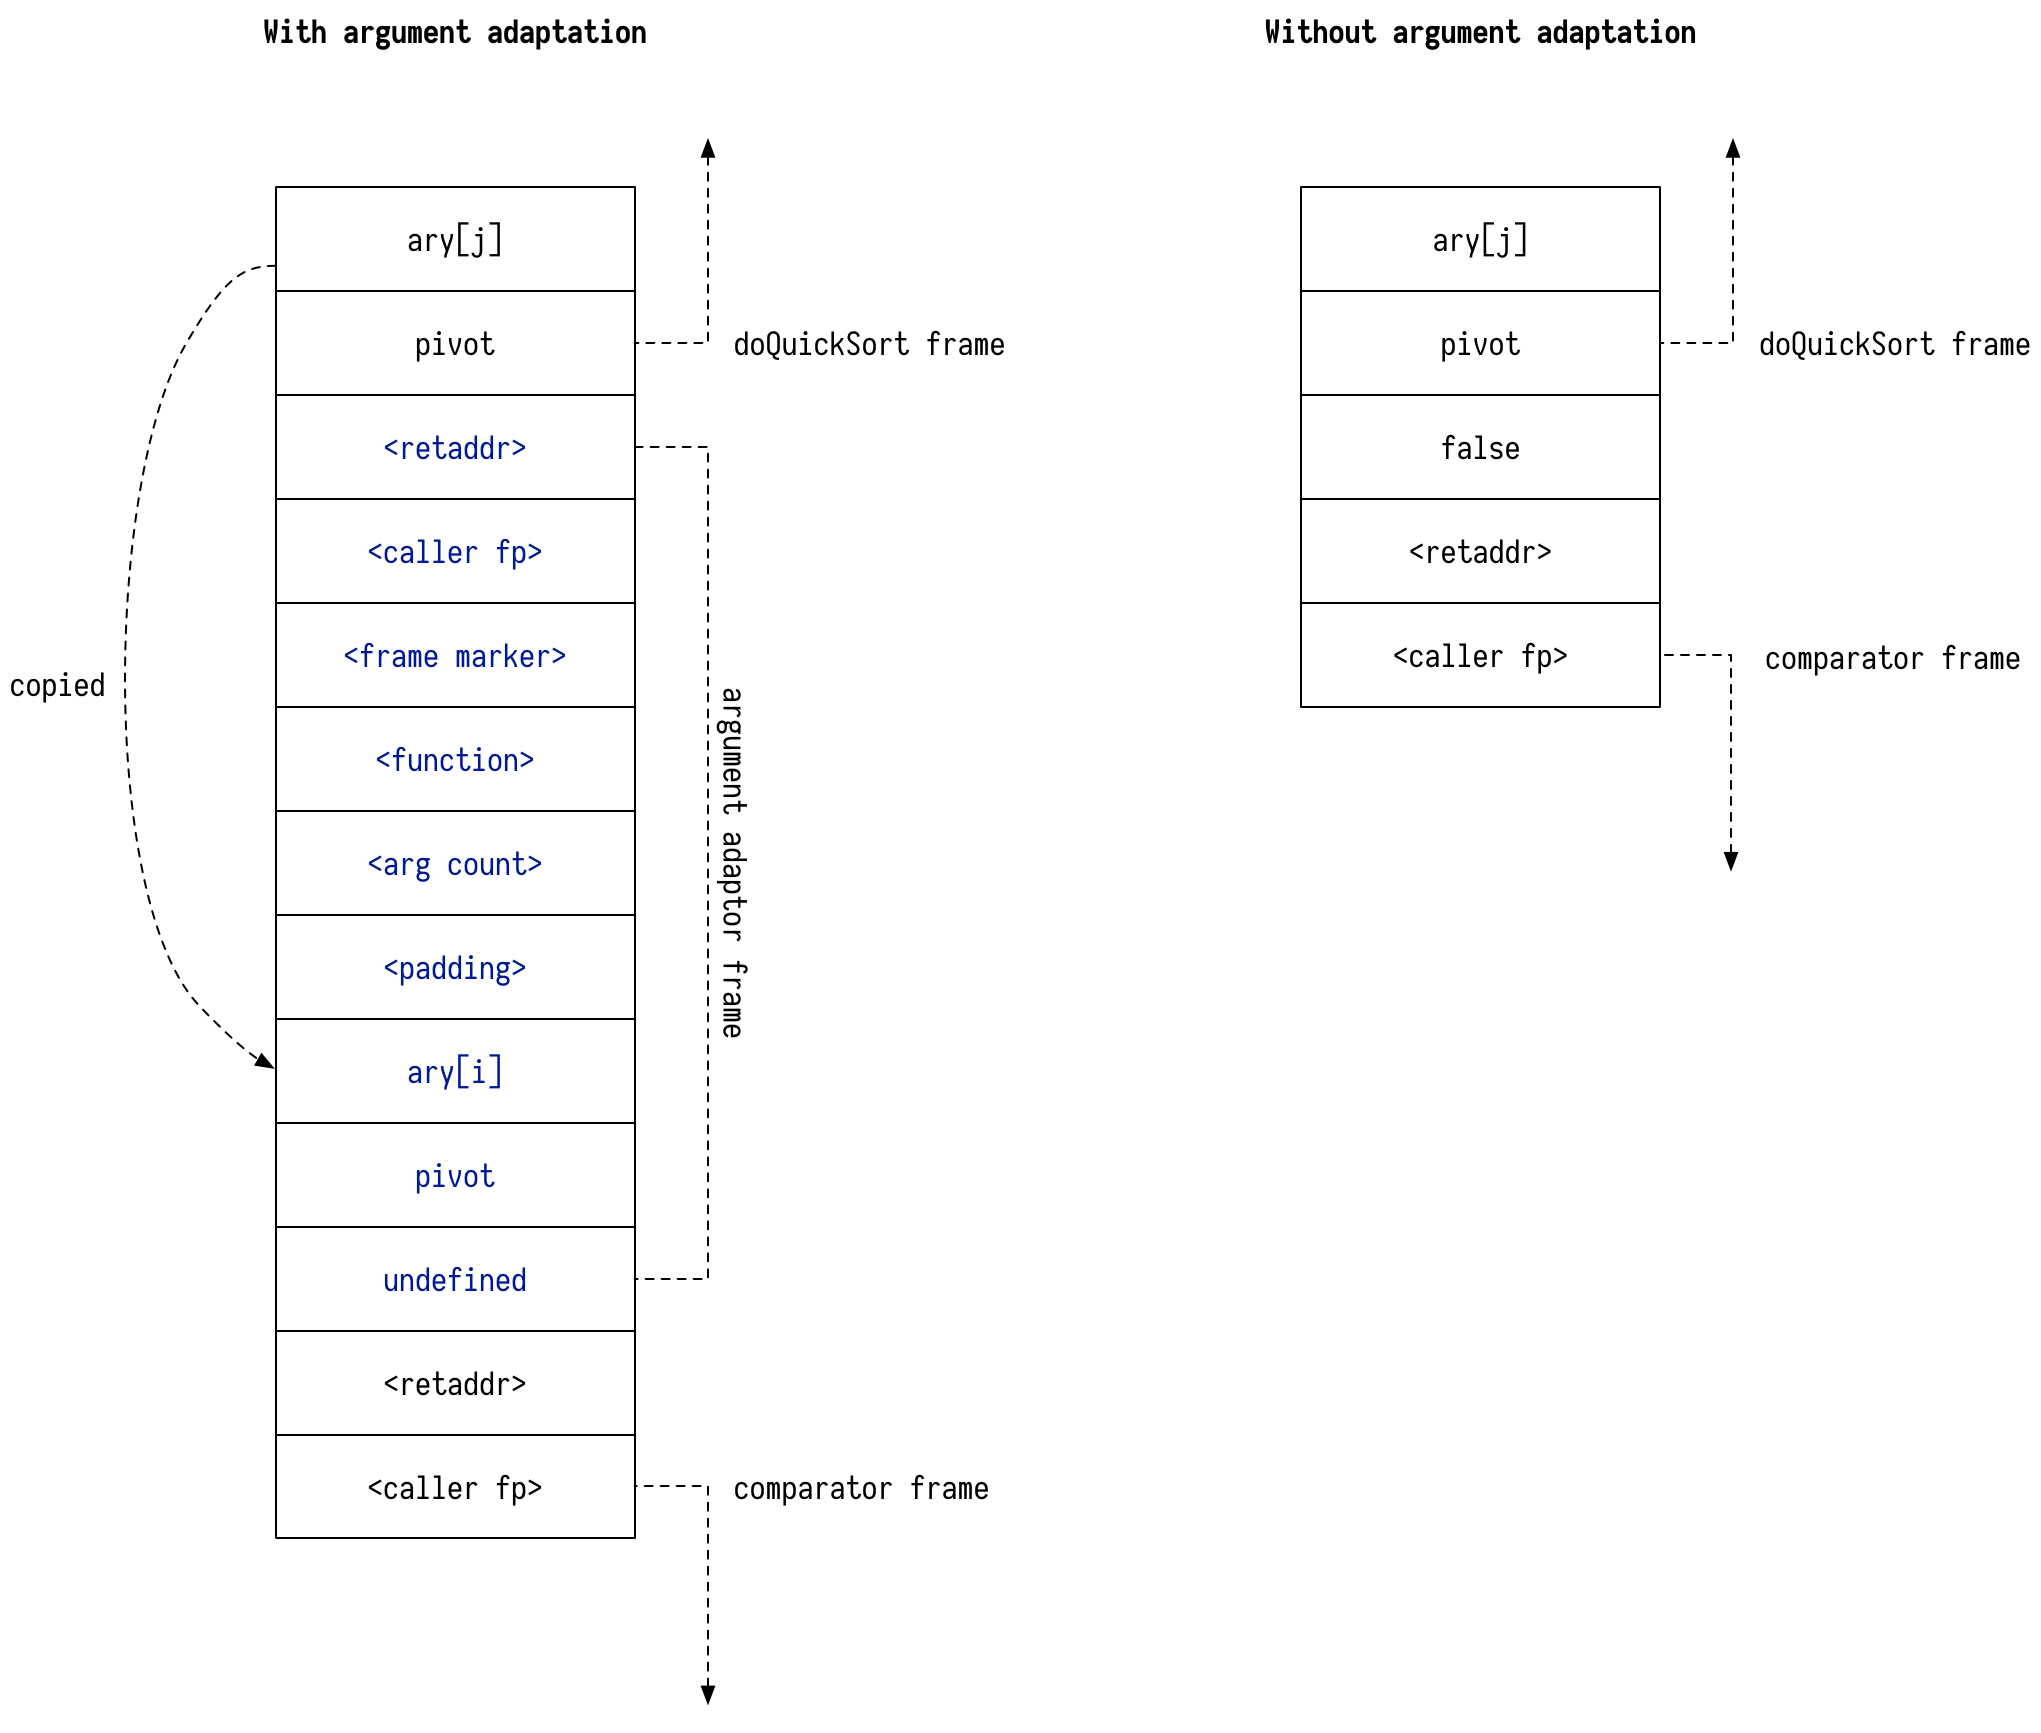
It turns out that ArgumentsAdaptorTrampoline is V8’s mechanism for coping with
JavaScript’s variadic calling convention: you can call function that
has 3 parameters with 2 arguments - in which case the third parameter will be
filled with undefined. V8 does this by creating a new frame on the stack,
copying arguments down and then invoking the target function:
[If you have never heard about execution stack, checkout out Wikipedia and Franziska Hinkelmann’s blog post.]
While such costs might be negligible for cold code, in this code comparator
was invoked millions of times during benchmark run which magnified overheads of
arguments adaptation.
An attentive reader might also notice that we are now explicitly passing boolean
value false where previously an implicit undefined was used. This does
seem to contribute a bit to the performance improvement. If we replace false
with void 0 we would get slightly worse numbers:
diff --git a/dist/source-map.js b/dist/source-map.js
index 2d39b28..243b2ef 100644
--- a/dist/source-map.js
+++ b/dist/source-map.js
@@ -2779,7 +2779,7 @@ return /******/ (function(modules) { // webpackBootstrap
            //
            //   * Every element in `ary[i+1 .. j-1]` is greater than the pivot.
            for (var j = p; j < r; j++) {
-             if (comparator(ary[j], pivot, false) <= 0) {
+             if (comparator(ary[j], pivot, void 0) <= 0) {
                i += 1;
                swap(ary, i, j);
              }
╭─ ~/src/source-map/bench ‹perf-work U› [Fix comparator invocation arity]
╰─$ ~/src/v8/v8/out.gn/x64.release/d8 bench-shell-bindings.js
Parsing source map
console.timeEnd: iteration, 4215.623000
console.timeEnd: iteration, 4247.643000
console.timeEnd: iteration, 4425.871000
console.timeEnd: iteration, 4167.691000
console.timeEnd: iteration, 4343.613000
console.timeEnd: iteration, 4209.427000
[Stats samples: 6, total: 25610 ms, mean: 4268.333333333333 ms, stddev: 106.38947316346669 ms]
For what it is worth argument adaptation overhead seems to be highly V8 specific. When I benchmark my change against SpiderMonkey, I don’t see any significant performance improvement from matching the arity:
╭─ ~/src/source-map/bench ‹ d052ea4› [Disabled serialization part of the benchmark]
╰─$ sm bench-shell-bindings.js
Parsing source map
[Stats samples: 8, total: 24751 ms, mean: 3093.875 ms, stddev: 327.27966571700836 ms]
╭─ ~/src/source-map/bench ‹perf-work› [Fix comparator invocation arity]
╰─$ sm bench-shell-bindings.js
Parsing source map
[Stats samples: 8, total: 25397 ms, mean: 3174.625 ms, stddev: 360.4636187025859 ms]
[SpiderMonkey shell is now very easy to install thanks to Mathias Bynens’es jsvu tool.]
Let us get back to the sorting code. If we profile the benchmark again we will
notice that ArgumentsAdaptorTrampoline is gone for good from the profile, but
CallFunction_ReceiverIsNullOrUndefined is still there. This is not surprising
given that we are still calling the comparator.
Optimizing Sorting - Monomorphisation
What usually performs better than calling the function? Not calling it!
The obvious option here is to try and get the comparator inlined into the
doQuickSort. However the fact that doQuickSort is called with different
comparator functions stands in the way of inlining.
To work around this we can try to monomorphise doQuickSort by cloning it. Here
is how we do it.
We start by wrapping doQuickSort and other helpers into SortTemplate
function:
function SortTemplate(comparator) {
  function swap(ary, x, y) {
    // ...
  }

  function randomIntInRange(low, high) {
    // ...
  }

  function doQuickSort(ary, p, r) {
    // ...
  }

  return doQuickSort;
}
Then we can produce clones of our sorting routines by converting SortTemplate
into a string and then parsing it back into a function via Function
constructor:
function cloneSort(comparator) {
  let template = SortTemplate.toString();
  let templateFn = new Function(`return ${template}`)();
  return templateFn(comparator);  // Invoke template to get doQuickSort
}
Now we can use cloneSort to produce a sort function for each comparator we
are using:
let sortCache = new WeakMap();  // Cache for specialized sorts.
exports.quickSort = function (ary, comparator) {
  let doQuickSort = sortCache.get(comparator);
  if (doQuickSort === void 0) {
    doQuickSort = cloneSort(comparator);
    sortCache.set(comparator, doQuickSort);
  }
  doQuickSort(ary, 0, ary.length - 1);
};
Rerunning benchmark yields:
╭─ ~/src/source-map/bench ‹perf-work› [Clone sorting functions for each comparator]
╰─$ d8 bench-shell-bindings.js
Parsing source map
console.timeEnd: iteration, 2955.199000
console.timeEnd: iteration, 3084.979000
console.timeEnd: iteration, 3193.134000
console.timeEnd: iteration, 3480.459000
console.timeEnd: iteration, 3115.011000
console.timeEnd: iteration, 3216.344000
console.timeEnd: iteration, 3343.459000
console.timeEnd: iteration, 3036.211000
[Stats samples: 8, total: 25423 ms, mean: 3177.875 ms, stddev: 181.87633161024556 ms]
We can see that the mean time went from 4268 ms to 3177 ms (25% improvement).
Profiling reveals the following picture:
 Overhead Symbol
   14.95% *doQuickSort :44
   11.49% *doQuickSort :44
    3.29% Builtin:StringEqual
    3.13% *SourceMapConsumer_parseMappings ../dist/source-map.js:1894
    1.86% v8::internal::StringTable::LookupStringIfExists_NoAllocate
    1.86% *SourceMapConsumer_parseMappings ../dist/source-map.js:1894
    1.72% Builtin:StringCharAt
    1.67% *SourceMapConsumer_parseMappings ../dist/source-map.js:1894
    1.61% v8::internal::Scavenger::ScavengeObject
    1.45% v8::internal::(anonymous namespace)::StringTableNoAllocateKey::IsMatch
    1.23% Builtin:StringPrototypeSlice
    1.17% v8::internal::(anonymous namespace)::MakeStringThin
    1.08% Builtin:KeyedLoadIC_Megamorphic
    1.05% v8::internal::(anonymous namespace)::CopyObjectToObjectElements
    0.99% v8::internal::String::VisitFlat<v8::internal::IteratingStringHasher>
    0.86% clear_page_c_e
    0.77% v8::internal::IncrementalMarking::RecordWriteSlow
    0.48% Builtin:MathRandom
    0.41% Builtin:RecordWrite
    0.39% Builtin:KeyedLoadIC
Overheads related to invoking comparator have now completely disappeared
from the profile.
At this point I became interested in how much time we spend parsing
mappings vs. sorting them. I went into the parsing code and added few
Date.now() invocations:
[I wanted to sprinkle performance.now() but SpiderMonkey
shell apparently does not support it.]
diff --git a/dist/source-map.js b/dist/source-map.js
index 75ebbdf..7312058 100644
--- a/dist/source-map.js
+++ b/dist/source-map.js
@@ -1906,6 +1906,8 @@ return /******/ (function(modules) { // webpackBootstrap
            var generatedMappings = [];
            var mapping, str, segment, end, value;

+
+      var startParsing = Date.now();
            while (index < length) {
              if (aStr.charAt(index) === ';') {
                generatedLine++;
@@ -1986,12 +1988,20 @@ return /******/ (function(modules) { // webpackBootstrap
                }
              }
            }
+      var endParsing = Date.now();

+      var startSortGenerated = Date.now();
            quickSort(generatedMappings, util.compareByGeneratedPositionsDeflated);
            this.__generatedMappings = generatedMappings;
+      var endSortGenerated = Date.now();

+      var startSortOriginal = Date.now();
            quickSort(originalMappings, util.compareByOriginalPositions);
            this.__originalMappings = originalMappings;
+      var endSortOriginal = Date.now();
+
+      console.log(`${}, ${endSortGenerated - startSortGenerated}, ${endSortOriginal - startSortOriginal}`);
+      console.log(`sortGenerated: `);
+      console.log(`sortOriginal:  `);
          };
This yielded:
╭─ ~/src/source-map/bench ‹perf-work U› [Clone sorting functions for each comparator]
╰─$ d8 bench-shell-bindings.js
Parsing source map
parse:         1911.846
sortGenerated: 619.5990000000002
sortOriginal:  905.8220000000001
parse:         1965.4820000000004
sortGenerated: 602.1939999999995
sortOriginal:  896.3589999999995
^C
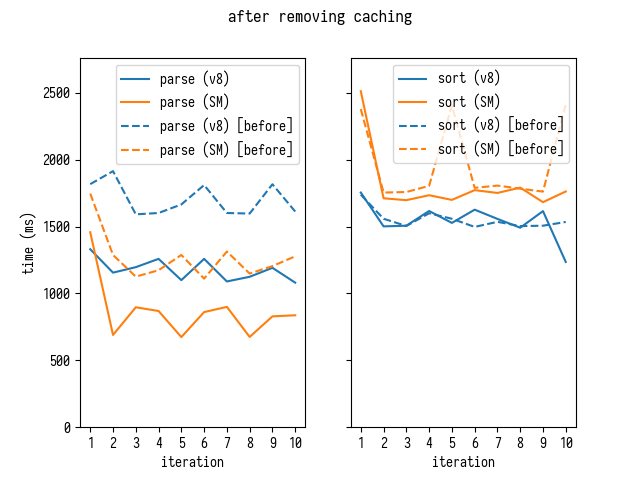
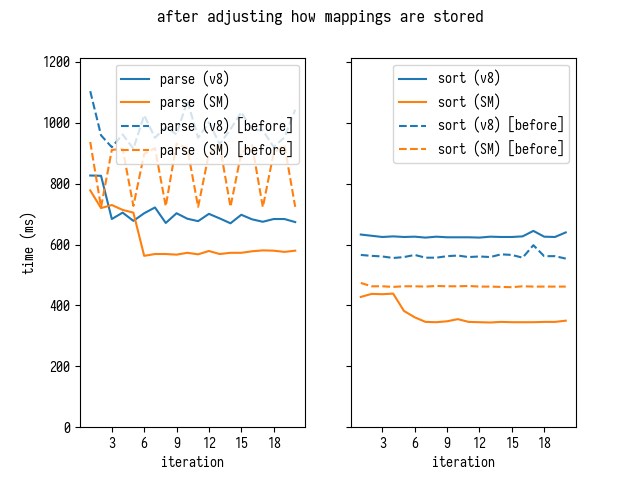
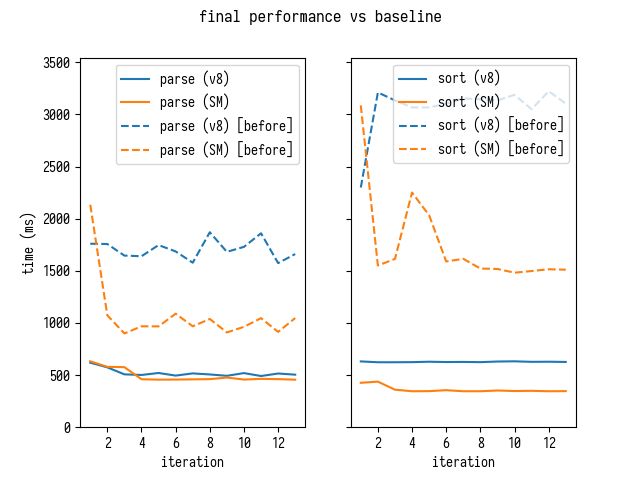
Here is how parsing and sorting times look like in V8 and SpiderMonkey per benchmark iteration run:
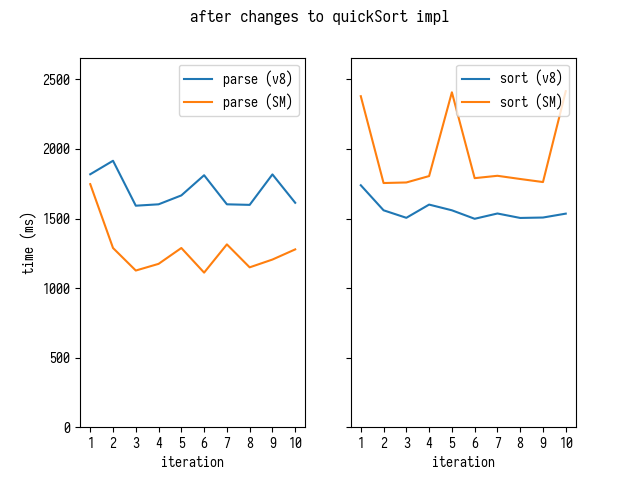
In V8 we seem to be spending roughly as much time parsing mappings as sorting them. In SpiderMonkey parsing is considerably faster - while sorting is slower. This prompted me to start looking at the parsing code.
Optimizing Parsing - Removing Segment Cache
Lets take a look at the profile again
Overhead  Symbol
  18.23%  *doQuickSort :44
  12.36%  *doQuickSort :44
   3.84%  *SourceMapConsumer_parseMappings ../dist/source-map.js:1894
   3.07%  Builtin:StringEqual
   1.92%  v8::internal::StringTable::LookupStringIfExists_NoAllocate
   1.85%  *SourceMapConsumer_parseMappings ../dist/source-map.js:1894
   1.59%  *SourceMapConsumer_parseMappings ../dist/source-map.js:1894
   1.54%  Builtin:StringCharAt
   1.52%  v8::internal::(anonymous namespace)::StringTableNoAllocateKey::IsMatch
   1.38%  v8::internal::Scavenger::ScavengeObject
   1.27%  Builtin:KeyedLoadIC_Megamorphic
   1.22%  Builtin:StringPrototypeSlice
   1.10%  v8::internal::(anonymous namespace)::MakeStringThin
   1.05%  v8::internal::(anonymous namespace)::CopyObjectToObjectElements
   1.03%  v8::internal::String::VisitFlat<v8::internal::IteratingStringHasher>
   0.88%  clear_page_c_e
   0.51%  Builtin:MathRandom
   0.48%  Builtin:KeyedLoadIC
   0.46%  v8::internal::IteratingStringHasher::Hash
   0.41%  Builtin:RecordWrite
Removing the JavaScript code we recognize leaves us with the following:
Overhead  Symbol
   3.07%  Builtin:StringEqual
   1.92%  v8::internal::StringTable::LookupStringIfExists_NoAllocate
   1.54%  Builtin:StringCharAt
   1.52%  v8::internal::(anonymous namespace)::StringTableNoAllocateKey::IsMatch
   1.38%  v8::internal::Scavenger::ScavengeObject
   1.27%  Builtin:KeyedLoadIC_Megamorphic
   1.22%  Builtin:StringPrototypeSlice
   1.10%  v8::internal::(anonymous namespace)::MakeStringThin
   1.05%  v8::internal::(anonymous namespace)::CopyObjectToObjectElements
   1.03%  v8::internal::String::VisitFlat<v8::internal::IteratingStringHasher>
   0.88%  clear_page_c_e
   0.51%  Builtin:MathRandom
   0.48%  Builtin:KeyedLoadIC
   0.46%  v8::internal::IteratingStringHasher::Hash
   0.41%  Builtin:RecordWrite
When I started looking at call chains for individual entries I discovered that
many of them pass through KeyedLoadIC_Megamorphic into
SourceMapConsumer_parseMappings.
-    1.92% v8::internal::StringTable::LookupStringIfExists_NoAllocate
   - v8::internal::StringTable::LookupStringIfExists_NoAllocate
      + 99.80% Builtin:KeyedLoadIC_Megamorphic

-    1.52% v8::internal::(anonymous namespace)::StringTableNoAllocateKey::IsMatch
   - v8::internal::(anonymous namespace)::StringTableNoAllocateKey::IsMatch
      - 98.32% v8::internal::StringTable::LookupStringIfExists_NoAllocate
         + Builtin:KeyedLoadIC_Megamorphic
      + 1.68% Builtin:KeyedLoadIC_Megamorphic

-    1.27% Builtin:KeyedLoadIC_Megamorphic
   - Builtin:KeyedLoadIC_Megamorphic
      + 57.65% *SourceMapConsumer_parseMappings ../dist/source-map.js:1894
      + 22.62% *SourceMapConsumer_parseMappings ../dist/source-map.js:1894
      + 15.91% *SourceMapConsumer_parseMappings ../dist/source-map.js:1894
      + 2.46% Builtin:InterpreterEntryTrampoline
      + 0.61% BytecodeHandler:Mul
      + 0.57% *doQuickSort :44

-    1.10% v8::internal::(anonymous namespace)::MakeStringThin
   - v8::internal::(anonymous namespace)::MakeStringThin
      - 94.72% v8::internal::StringTable::LookupStringIfExists_NoAllocate
         + Builtin:KeyedLoadIC_Megamorphic
      + 3.63% Builtin:KeyedLoadIC_Megamorphic
      + 1.66% v8::internal::StringTable::LookupString
This sort of call stacks indicated to me that the code is performing a lot of
keyed lookups of form obj[key] where key is dynamically built string. When I
looked at the parsing I discovered the following code:
// Because each offset is encoded relative to the previous one,
// many segments often have the same encoding. We can exploit this
// fact by caching the parsed variable length fields of each segment,
// allowing us to avoid a second parse if we encounter the same
// segment again.
for (end = index; end < length; end++) {
  if (this._charIsMappingSeparator(aStr, end)) {
    break;
  }
}
str = aStr.slice(index, end);

segment = cachedSegments[str];
if (segment) {
  index += str.length;
} else {
  segment = [];
  while (index < end) {
    base64VLQ.decode(aStr, index, temp);
    value = temp.value;
    index = temp.rest;
    segment.push(value);
  }

  // ...

  cachedSegments[str] = segment;
}
This code is responsible for decoding Base64 VLQ encoded sequences, e.g. a string
A would be decoded as [0] and UAAAA gets decoded as [10,0,0,0,0]. I
suggest checking this blog post about
source maps internals if you would like to understand the encoding itself
better.
Instead of decoding each sequence independently this code attempts to cache
decoded segments: it scans forward until a separator (, or ;) is found,
then extracts substring from the current position to the separator and
checks if we have previous decoded such segment by looking up the extracted
substring in a cache - if we hit the cache we return cached segment, otherwise
we parse and cache the segment in the cache.
Caching (aka memoization) is a very powerful optimization technique - however it only makes sense when maintaining the cache itself and looking up cached results is cheaper than performing computation itself again.
Abstract Analysis
Lets try to compare these two operations abstractly.
On one hand is pure parsing:
Parsing segment looks at each character of a segment once. For each character it performs few comparisons and arithmetic operations to convert a base64 character into an integer value it represents. Then it performs few bitwise operations to incorporate this integer value into a larger integer value. Then it stores decoded value into an array and moves to the next part of the segment. Segments are limited to 5 elements.
On the other hand caching:
- To look up a cached value we traverse all the characters of the segment once to find its end;
- We extract the substring, which requires allocation and potentially copying depending on how strings are implemented in a JS VM;
- We use this string as a key in a dictionary, which:
- first requires VM to compute hash for this string (traversing it again and performing various bitwise operations on individual characters), this might also require VM to internalize the string (depending on implementation);
- then VM has to perform a hash table lookup, which requires probing and comparing key by value with other keys (which might require it again to look at individual characters in a string);
Overall it seems that direct parsing should be faster, assuming that JS VM does good job with individual arithmetic/bitwise operations, simply because it looks at each individual character only once, where caching requires traversing the segment 2-4 times just to establish whether we hit the cache or not.
Profile seems to confirm this too: KeyedLoadIC_Megamorphic is a stub used
by V8 to implement keyed lookups like cachedSegments[str] in the code above.
Based on these observations I set out to do few experiments. First I checked how
big cachedSegments cache is at the end of the parsing. The smaller it is the
more efficient caching would be.
Turns out that it grows quite big:
Object.keys(cachedSegments).length = 155478
Standalone Microbenchmarks
Now I decided to write a small standalone benchmark:
// Generate a string with [n] segments, segments repeat in a cycle of length
// [v] i.e. segments number 0, v, 2*v, ... are all equal and so are
// 1, 1 + v, 1 + 2*v, ...
// Use [base] as a base value in a segment - this parameter allows to make
// segments long.
//
// Note: the bigger [v], the bigger [cachedSegments] cache is.
function makeString(n, v, base) {
  var arr = [];
  for (var i = 0; i < n; i++) {
    arr.push([0, base + (i % v), 0, 0].map(base64VLQ.encode).join(''));
  }
  return arr.join(';') + ';';
}

// Run function [f] against the string [str].
function bench(f, str) {
  for (var i = 0; i < 1000; i++) {
    f(str);
  }
}

// Measure and report performance of [f] against [str].
// It has [v] different segments.
function measure(v, str, f) {
  var start = Date.now();
  bench(f, str);
  var end = Date.now();
  report(`${v}, ${f.name}, ${(end - start).toFixed(2)}`);
}

async function measureAll() {
  for (let v = 1; v <= 256; v *= 2) {
    // Make a string with 1000 total segments and [v] different ones
    // so that [cachedSegments] has [v] cached segments.
    let str = makeString(1000, v, 1024 * 1024);

    let arr = encoder.encode(str);

    // Run 10 iterations for each way of decoding.
    for (var j = 0; j < 10; j++) {
     measure(j, i, str, decodeCached);
     measure(j, i, str, decodeNoCaching);
     measure(j, i, str, decodeNoCachingNoStrings);
     measure(j, i, arr, decodeNoCachingNoStringsPreEncoded);
     await nextTick();
    }
  }
}

function nextTick() { return new Promise((resolve) => setTimeout(resolve)); }
There are three different ways to decode Base64 VLQ segments that I tried against each other.
The first one decodeCached is exactly the same as the default
implementation used by source-map - which I already listed above:
function decodeCached(aStr) {
  var length = aStr.length;
  var cachedSegments = {};
  var end, str, segment, value, temp = {value: 0, rest: 0};
  const decode = base64VLQ.decode;

  var index = 0;
  while (index < length) {
    // Because each offset is encoded relative to the previous one,
    // many segments often have the same encoding. We can exploit this
    // fact by caching the parsed variable length fields of each segment,
    // allowing us to avoid a second parse if we encounter the same
    // segment again.
    for (end = index; end < length; end++) {
      if (_charIsMappingSeparator(aStr, end)) {
        break;
      }
    }
    str = aStr.slice(index, end);

    segment = cachedSegments[str];
    if (segment) {
      index += str.length;
    } else {
      segment = [];
      while (index < end) {
        decode(aStr, index, temp);
        value = temp.value;
        index = temp.rest;
        segment.push(value);
      }

      if (segment.length === 2) {
        throw new Error('Found a source, but no line and column');
      }

      if (segment.length === 3) {
        throw new Error('Found a source and line, but no column');
      }

      cachedSegments[str] = segment;
    }

    index++;
  }
}
The next competitor is decodeNoCaching. It is essentially decodeCached but
without the cache. Each segment is decoded independently. I also replaced
Array with Int32Array for segment storage.
function decodeNoCaching(aStr) {
  var length = aStr.length;
  var cachedSegments = {};
  var end, str, segment, temp = {value: 0, rest: 0};
  const decode = base64VLQ.decode;

  var index = 0, value;
  var segment = new Int32Array(5);
  var segmentLength = 0;
  while (index < length) {
    segmentLength = 0;
    while (!_charIsMappingSeparator(aStr, index)) {
      decode(aStr, index, temp);
      value = temp.value;
      index = temp.rest;
      if (segmentLength >= 5) throw new Error('Too many segments');
      segment[segmentLength++] = value;
    }

    if (segmentLength === 2) {
      throw new Error('Found a source, but no line and column');
    }

    if (segmentLength === 3) {
      throw new Error('Found a source and line, but no column');
    }

    index++;
  }
}
Finally the third variant decodeNoCachingNoString tries to avoid
dealing with JavaScript strings altogether by converting the string into
utf8 encoded Uint8Array. This optimization is inspired by the fact that JS VMs
are more likely to optimize an array load down to a single memory access. Optimizing
String.prototype.charCodeAt to the same extent is harder due to the sheer
complexity of the hierarchy of different string representations that JS VMs
utilize.
I benchmarked both a version that encodes string into utf8 as part of the iteration and a version that uses preencoded string. With this latter “optimistic” version I am trying to estimate how much we could gain if we were able to skip typed array ⇒ string ⇒ typed array round trip. Which would be possible if we loaded the source map directly as an array buffer and parsed it directly from that buffer instead of converting it to string first.
let encoder = new TextEncoder();
function decodeNoCachingNoString(aStr) {
  decodeNoCachingNoStringPreEncoded(encoder.encode(aStr));
}

function decodeNoCachingNoStringPreEncoded(arr) {
  var length = arr.length;
  var cachedSegments = {};
  var end, str, segment, temp = {value: 0, rest: 0};
  const decode2 = base64VLQ.decode2;

  var index = 0, value;
  var segment = new Int32Array(5);
  var segmentLength = 0;
  while (index < length) {
    segmentLength = 0;
    while (arr[index] != 59 && arr[index] != 44) {
      decode2(arr, index, temp);
      value = temp.value;
      index = temp.rest;
      if (segmentLength < 5) {
        segment[segmentLength++] = value;
      }
    }

    if (segmentLength === 2) {
      throw new Error('Found a source, but no line and column');
    }

    if (segmentLength === 3) {
      throw new Error('Found a source and line, but no column');
    }

    index++;
  }
}
Here are the results I’ve gotten by running my microbenchmark in Chrome Dev
66.0.3343.3 (V8 6.6.189) and Firefox Nightly 60.0a1 (2018-02-11):
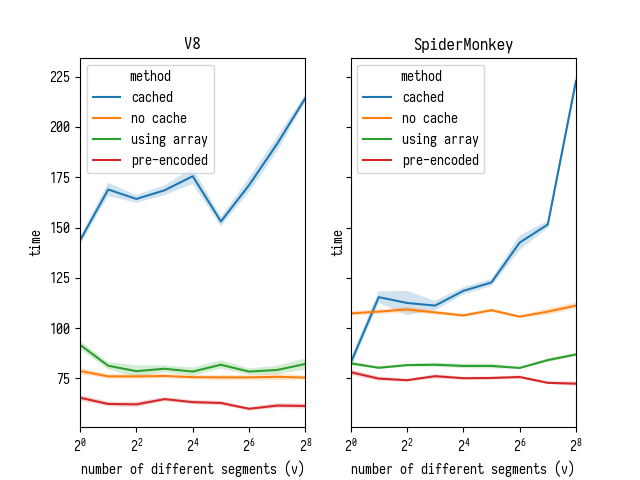
There are few things to notice here:
- the version that uses caching is slower than anything else on both V8 and SpiderMonkey. Its performance degrades steeply as number of cache entries grows - while performance of non-caching versions does not depend on that;
- on SpiderMonkey it pays off to convert string into typed array as part of parsing, while on V8 character access is fast enough - so it only pays off to use array if you can move string-to-array conversion out of the benchmark (e.g. you load your data into typed arrays to begin with);
I was curious if V8 team did any work recently to improve charCodeAt
performance - as I remembered rather vividly that Crankshaft never made an
effort to specialize charCodeAt for a particular string
representation at a call-site and instead expanded charCodeAt into a large
chunk of code handling many different string representations, making loading
characters from strings slower than loading elements from typed arrays.
I trawled V8 issue tracker and found few active issues like these:
- Issue 6391: StringCharCodeAt slower than Crankshaft;
- Issue 7092: High overhead of String.prototype.charCodeAt in typescript test;
- Issue 7326: Performance degradation when looping across character codes of a string;
Some of the comments on these issues reference commits from late January 2018
and onward, which indicated to me that performance of charCodeAt is being
actively worked on. Out of curiosity I decided to rerun my microbenchmark
in Chrome Beta and compare against Chrome Dev
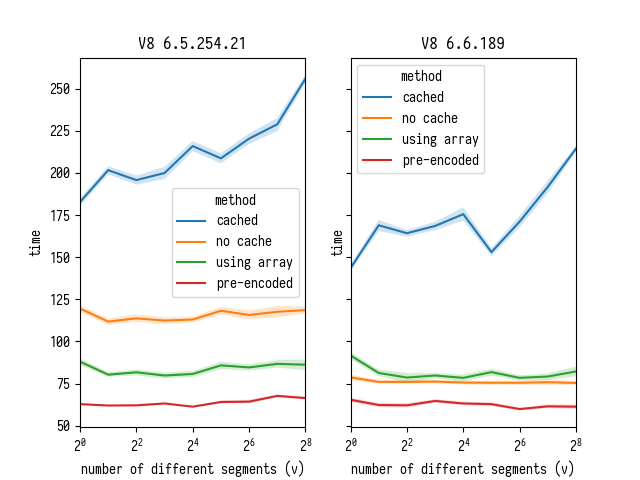
This comparison does in fact confirm that all those commits by the V8 team were
not for nothing: performance of charCodeAt improved drastically from
version 6.5.254.21 to 6.6.189. Comparing “no cache” and “using array” lines
we can see that on an older V8 charCodeAt behaved so much worse that it made
sense to convert the string into Uint8Array just to access it faster. However
the overhead of doing this conversion inside the parse does not pay off anymore
in a newer V8.
However it still pays off to use an array instead of a string as long as you don’t have to pay the conversion cost. Why is that? To figure that out I run the following code in tip-of-the tree V8:
function foo(str, i) {
  return str.charCodeAt(i);
}

let str = "fisk";

foo(str, 0);
foo(str, 0);
foo(str, 0);
%OptimizeFunctionOnNextCall(foo);
foo(str, 0);
╭─ ~/src/v8/v8 ‹master›
╰─$ out.gn/x64.release/d8 --allow-natives-syntax --print-opt-code --code-comments x.js
The command produced a gigantic assembly listing
confirming my suspicion that V8 still does not specialize charCodeAt for a
particular string representation. This lowering seems to come from this code
in V8 sources, which resolves the mystery of why array access is faster than
string charCodeAt.
Parsing Improvements
In light of these discoveries lets remove caching of parsed segments from
source-map parsing code and measure the effect.
Just like our microbenchmarking predicted caching was detrimental to the overall performance rather than being beneficial: removing it actually improves parsing times considerably.
Optimizing Sorting - Algorithmic Improvements
Now that we improved parsing performance lets take a look at the sorting again.
There are two arrays that are being sorted:
originalMappingsarray is being sorted usingcompareByOriginalPositionscomparator;generatedMappingsarray is being sorted usingcompareByGeneratedPositionsDeflatedcomparator.
Optimizing originalMappings Sorting
I took a look at compareByOriginalPositions first.
function compareByOriginalPositions(mappingA, mappingB, onlyCompareOriginal) {
  var cmp = strcmp(mappingA.source, mappingB.source);
  if (cmp !== 0) {
    return cmp;
  }

  cmp = mappingA.originalLine - mappingB.originalLine;
  if (cmp !== 0) {
    return cmp;
  }

  cmp = mappingA.originalColumn - mappingB.originalColumn;
  if (cmp !== 0 || onlyCompareOriginal) {
    return cmp;
  }

  cmp = mappingA.generatedColumn - mappingB.generatedColumn;
  if (cmp !== 0) {
    return cmp;
  }

  cmp = mappingA.generatedLine - mappingB.generatedLine;
  if (cmp !== 0) {
    return cmp;
  }

  return strcmp(mappingA.name, mappingB.name);
}
Here I noticed that mappings are being ordered by source component first and
then by all other components. source specifies which source file the mapping
originally came from. An obvious idea here is that instead of using a flat
gigantic originalMappings array, which mixes together mappings from different
source files, we can turn originalMappings into array of arrays:
originalMappings[i] would be an array of all mappings from source file with index i.
This way we can sort mappings into different originalMappings[i] arrays based
on their source as we parse them and then sort individual smaller arrays.
[This is essentially a Bucket Sort]
Here is what we do in parsing loop:
if (typeof mapping.originalLine === 'number') {
  // This code used to just do: originalMappings.push(mapping).
  // Now it sorts original mappings already by source during parsing.
  let currentSource = mapping.source;
  while (originalMappings.length <= currentSource) {
    originalMappings.push(null);
  }
  if (originalMappings[currentSource] === null) {
    originalMappings[currentSource] = [];
  }
  originalMappings[currentSource].push(mapping);
}
And then after that:
var startSortOriginal = Date.now();
// The code used to sort the whole array:
//     quickSort(originalMappings, util.compareByOriginalPositions);
for (var i = 0; i < originalMappings.length; i++) {
  if (originalMappings[i] != null) {
    quickSort(originalMappings[i], util.compareByOriginalPositionsNoSource);
  }
}
var endSortOriginal = Date.now();
The compareByOriginalPositionsNoSource comparator is almost exactly the same
as compareByOriginalPositions comparator except it does not compare source
component anymore - those are guaranteed to be equal due to the way we
constructed each originalMappings[i] array.
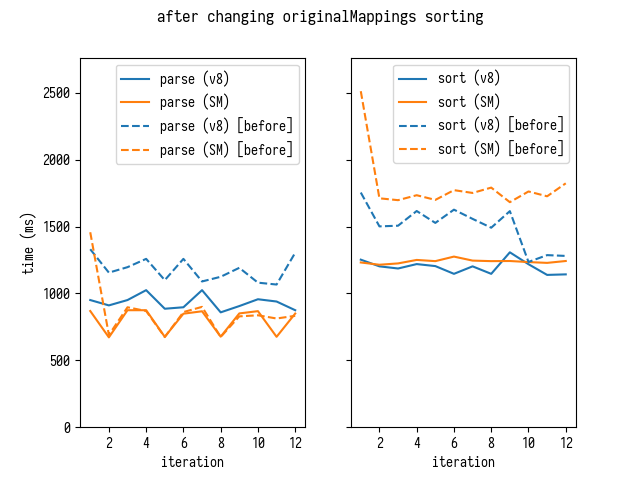
This algorithmic change improves sorting times on both V8 and SpiderMonkey and additionally improves parsing times on V8.
[Parse time improvement is likely due
to the reduction of costs associated with managing originalMappings array:
growing a single gigantic originalMappings array is more expensive than
growing multiple smaller originalMappings[i] arrays individually. However
this is just my guess, which is not confirmed by any rigorous analysis.]
Optimizing generatedMappings Sorting
Let us take a look at generatedMappings and compareByGeneratedPositionsDeflated
comparator.
function compareByGeneratedPositionsDeflated(mappingA, mappingB, onlyCompareGenerated) {
  var cmp = mappingA.generatedLine - mappingB.generatedLine;
  if (cmp !== 0) {
    return cmp;
  }

  cmp = mappingA.generatedColumn - mappingB.generatedColumn;
  if (cmp !== 0 || onlyCompareGenerated) {
    return cmp;
  }

  cmp = strcmp(mappingA.source, mappingB.source);
  if (cmp !== 0) {
    return cmp;
  }

  cmp = mappingA.originalLine - mappingB.originalLine;
  if (cmp !== 0) {
    return cmp;
  }

  cmp = mappingA.originalColumn - mappingB.originalColumn;
  if (cmp !== 0) {
    return cmp;
  }

  return strcmp(mappingA.name, mappingB.name);
}
Here we first compare mappings by generatedLine. There are likely considerably
more generated lines than original source files so it does not make sense
to split generatedMappings into multiple individual arrays.
However when I looked at the parsing code I noticed the following:
while (index < length) {
  if (aStr.charAt(index) === ';') {
    generatedLine++;
    // ...
  } else if (aStr.charAt(index) === ',') {
    // ...
  } else {
    mapping = new Mapping();
    mapping.generatedLine = generatedLine;

    // ...
  }
}
These are the only occurrences of generatedLine in this code, which means that
generatedLine is growing monotonically - implying that
generatedMappings array is already ordered by generatedLine and it does
not make sense to sort the array as whole. Instead we can sort each individual
smaller subarray. We change the code like this:
let subarrayStart = 0;
while (index < length) {
  if (aStr.charAt(index) === ';') {
    generatedLine++;
    // ...

    // Sort subarray [subarrayStart, generatedMappings.length].
    sortGenerated(generatedMappings, subarrayStart);
    subarrayStart = generatedMappings.length;
  } else if (aStr.charAt(index) === ',') {
    // ...
  } else {
    mapping = new Mapping();
    mapping.generatedLine = generatedLine;

    // ...
  }
}
// Sort the tail.
sortGenerated(generatedMappings, subarrayStart);
Instead of using quickSort for sorting smaller subarrays, I also decided to
use insertion sort, similar to
a hybrid strategy that some VMs use for Array.prototype.sort.
[Note: insertion sort is also faster than
quick sort if input array is already sorted… and it turns out that
mappings used for the benchmark are in fact sorted. If we expect generatedMappings
to be almost always sorted after parsing then it would be even more efficient to
simply check whether generatedMappings is sorted before trying to sort it.]
const compareGenerated = util.compareByGeneratedPositionsDeflatedNoLine;

function sortGenerated(array, start) {
  let l = array.length;
  let n = array.length - start;
  if (n <= 1) {
    return;
  } else if (n == 2) {
    let a = array[start];
    let b = array[start + 1];
    if (compareGenerated(a, b) > 0) {
      array[start] = b;
      array[start + 1] = a;
    }
  } else if (n < 20) {
    for (let i = start; i < l; i++) {
      for (let j = i; j > start; j--) {
        let a = array[j - 1];
        let b = array[j];
        if (compareGenerated(a, b) <= 0) {
          break;
        }
        array[j - 1] = b;
        array[j] = a;
      }
    }
  } else {
    quickSort(array, compareGenerated, start);
  }
}
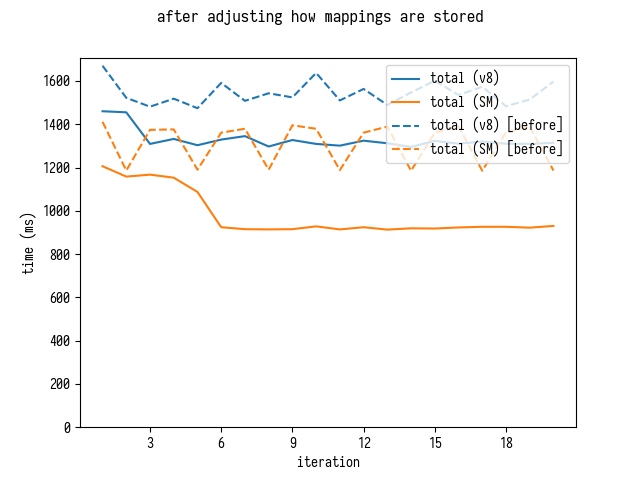
This yields the following result:
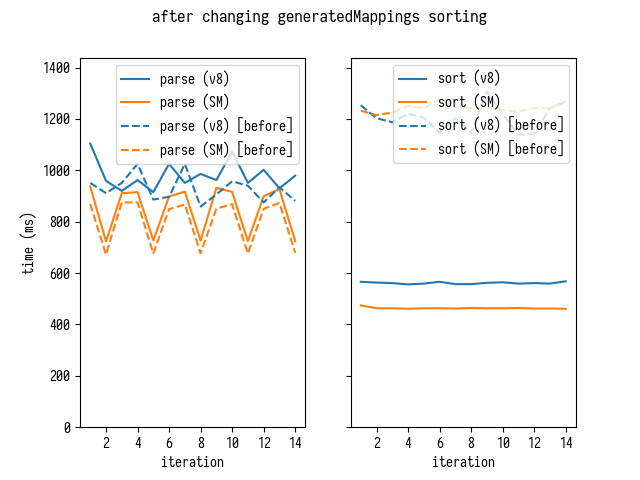
Sorting times drop drastically, while parsing times slightly increase - that
happens because the code sorting generatedMappings as part of the parsing
loop, making our breakdown slightly meaningless. Lets check comparison of
cumulative timings (parsing and sorting together)
Improvements to Total Time
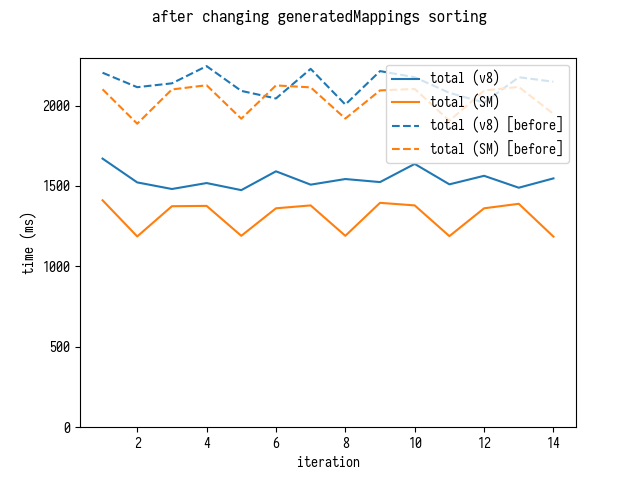
Now it becomes obvious that we considerably improved overall mappings parsing performance.
Is there anything else we could do to improve performance?
It turns out yes: we can pull out a page from asm.js / WASM own playbook without going full-Rust on our JavaScript code base.
Optimizing Parsing - Reducing GC Pressure
We are allocating hundreds of thousands of Mapping objects, which puts
considerable pressure on the GC - however we don’t really need these objects
to be objects - we can pack them into a typed array. Here is how I did it.
[Few years ago I was really excited about Typed Objects proposal which would allow JavaScript programmers to define structs and arrays of structs and all other amazing things that would come extremely handy here. Unfortunately champions working on that proposal moved away to work on other things leaving us with a choice to write these things either manually or in C++ 😞]
First, I changed Mapping from a normal object into a wrapper that
points into a gigantic typed array that would contain all our mappings.
function Mapping(memory) {
  this._memory = memory;
  this.pointer = 0;
}
Mapping.prototype = {
  get generatedLine () {
    return this._memory[this.pointer + 0];
  },
  get generatedColumn () {
    return this._memory[this.pointer + 1];
  },
  get source () {
    return this._memory[this.pointer + 2];
  },
  get originalLine () {
    return this._memory[this.pointer + 3];
  },
  get originalColumn () {
    return this._memory[this.pointer + 4];
  },
  get name () {
    return this._memory[this.pointer + 5];
  },
  set generatedLine (value) {
    this._memory[this.pointer + 0] = value;
  },
  set generatedColumn (value) {
    this._memory[this.pointer + 1] = value;
  },
  set source (value) {
    this._memory[this.pointer + 2] = value;
  },
  set originalLine (value) {
    this._memory[this.pointer + 3] = value;
  },
  set originalColumn (value) {
    this._memory[this.pointer + 4] = value;
  },
  set name (value) {
    this._memory[this.pointer + 5] = value;
  },
};
Then I adjusted the parsing and sorting code to use it like this:
BasicSourceMapConsumer.prototype._parseMappings = function (aStr, aSourceRoot) {
  // Allocate 4 MB memory buffer. This can be proportional to aStr size to
  // save memory for smaller mappings.
  this._memory = new Int32Array(1 * 1024 * 1024);
  this._allocationFinger = 0;
  let mapping = new Mapping(this._memory);
  // ...
  while (index < length) {
    if (aStr.charAt(index) === ';') {

      // All code that could previously access mappings directly now needs to
      // access them indirectly though memory.
      sortGenerated(this._memory, generatedMappings, previousGeneratedLineStart);
    } else {
      this._allocateMapping(mapping);

      // ...

      // Arrays of mappings now store "pointers" instead of actual mappings.
      generatedMappings.push(mapping.pointer);
      if (segmentLength > 1) {
        // ...
        originalMappings[currentSource].push(mapping.pointer);
      }
    }
  }

  // ...

  for (var i = 0; i < originalMappings.length; i++) {
    if (originalMappings[i] != null) {
      quickSort(this._memory, originalMappings[i], util.compareByOriginalPositionsNoSource);
    }
  }
};

BasicSourceMapConsumer.prototype._allocateMapping = function (mapping) {
  let start = this._allocationFinger;
  let end = start + 6;
  if (end > this._memory.length) {  // Do we need to grow memory buffer?
    let memory = new Int32Array(this._memory.length * 2);
    memory.set(this._memory);
    this._memory = memory;
  }
  this._allocationFinger = end;
  let memory = this._memory;
  mapping._memory = memory;
  mapping.pointer = start;
  mapping.name = 0x7fffffff;  // Instead of null use INT32_MAX.
  mapping.source = 0x7fffffff;  // Instead of null use INT32_MAX.
};

exports.compareByOriginalPositionsNoSource =
  function (memory, mappingA, mappingB, onlyCompareOriginal) {
  var cmp = memory[mappingA + 3] - memory[mappingB + 3];  // originalLine
  if (cmp !== 0) {
    return cmp;
  }

  cmp = memory[mappingA + 4] - memory[mappingB + 4];  // originalColumn
  if (cmp !== 0 || onlyCompareOriginal) {
    return cmp;
  }

  cmp = memory[mappingA + 1] - memory[mappingB + 1];  // generatedColumn
  if (cmp !== 0) {
    return cmp;
  }

  cmp = memory[mappingA + 0] - memory[mappingB + 0];  // generatedLine
  if (cmp !== 0) {
    return cmp;
  }

  return memory[mappingA + 5] - memory[mappingB + 5];  // name
};
As you can see readability does suffer quite a bit. Ideally I would prefer to
allocate a temporary Mapping object whenever I need to work with its fields.
However such code style would lean heavily on VMs ability to eliminate
allocations of these temporary wrappers via allocation sinking, scalar replacement
or other similar optimizations. Unfortunately in my experiments SpiderMonkey
could not deal with such code well enough and thus I opted for much more verbose
and error prone code.
[This sort of almost manual memory management might seem
rather foreign in JS. That’s why I think it might be worth mentioning here that
“oxidized” source-map actually requires users to manually manage
its lifetime to ensure that WASM resources are freed]
Rerunning benchmark confirms that alleviating GC pressure yields a nice improvement
Interestingly enough on SpiderMonkey this approach improves both parsing and sorting times, which came as a surprise to me.
SpiderMonkey Performance Cliff
As I was playing with this code I also discovered a confusing performance cliff in SpiderMonkey: when I increased the size of preallocated memory buffer from 4MB to 64MB to gauge reallocation costs, benchmark showed a sudden drop in performance after 7th iteration.
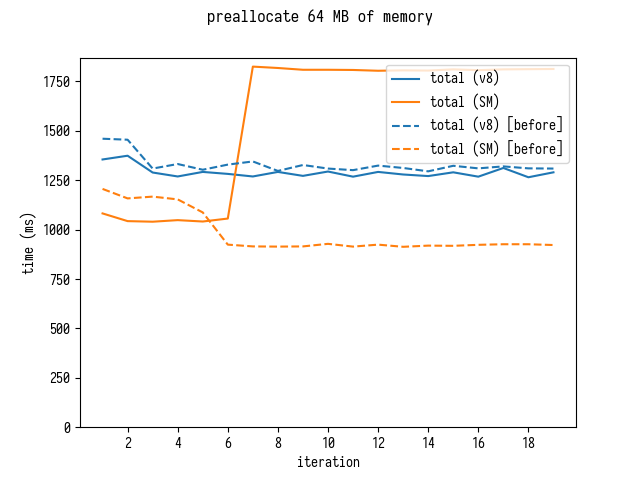
This looked like some sort of polymorphism to me, but I could not immediately figure out how changing the size of an array can result in a polymorphic behavior.
Puzzled I reached out to a SpiderMonkey hacker Jan de Mooij who very quickly identified an asm.js related optimization from 2012 as a culprit… then he went and removed it from SpiderMonkey so that nobody hits this confusing cliff again.
Optimizing Parsing - Using Uint8Array Instead of a String.
Finally if we start using Uint8Array instead of a string for parsing we get
yet another small improvement.
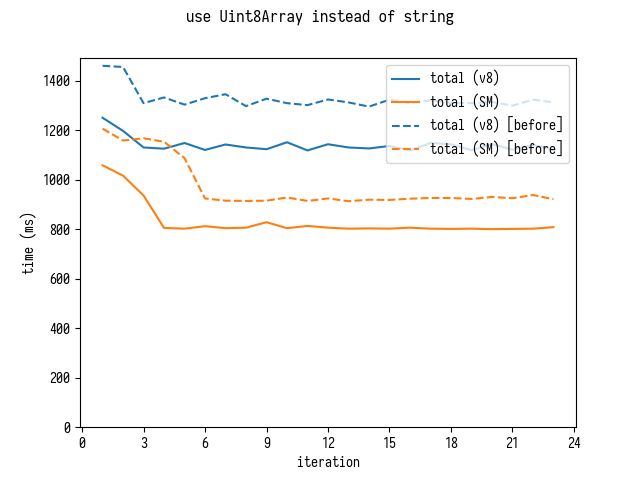
[This improvement is predicated on rewriting source-map to
parse mappings directly from typed arrays, instead of using JavaScript string
and parsing it with JSON.decode. I did not do such rewrite but I don’t
anticipate any issues.]
Total Improvements Against the Baseline
Here is where we started:
$ d8 bench-shell-bindings.js
...
[Stats samples: 5, total: 24050 ms, mean: 4810 ms, stddev: 155.91063145276527 ms]
$ sm bench-shell-bindings.js
...
[Stats samples: 7, total: 22925 ms, mean: 3275 ms, stddev: 269.5999093306804 ms]
and this is where we are finishing
$ d8 bench-shell-bindings.js
...
[Stats samples: 22, total: 25158 ms, mean: 1143.5454545454545 ms, stddev: 16.59358125226469 ms]
$ sm bench-shell-bindings.js
...
[Stats samples: 31, total: 25247 ms, mean: 814.4193548387096 ms, stddev: 5.591064299397745 ms]
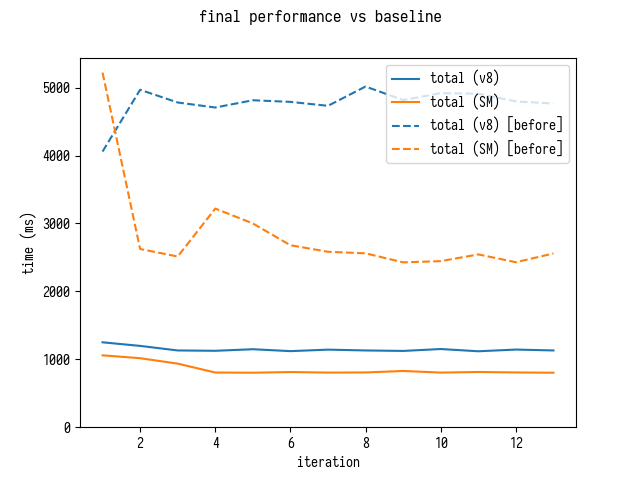
This is a factor of 4 improvement!
It might be also worth noting that we are still sorting all originalMappings
arrays eagerly even though this is not really needed. There are only two
operations that use originalMappings:
allGeneratedPositionsForwhich returns all generated positions for the given line in the original source;eachMapping(..., ORIGINAL_ORDER)which iterates over all mappings in their original order.
If we assume that allGeneratedPositionsFor is the most common operation and
that we are only going to search within a handful of originalMappings[i]
arrays then we can vastly improve parsing time by sorting originalMappings[i]
arrays lazily whenever we actually need to search one of them.
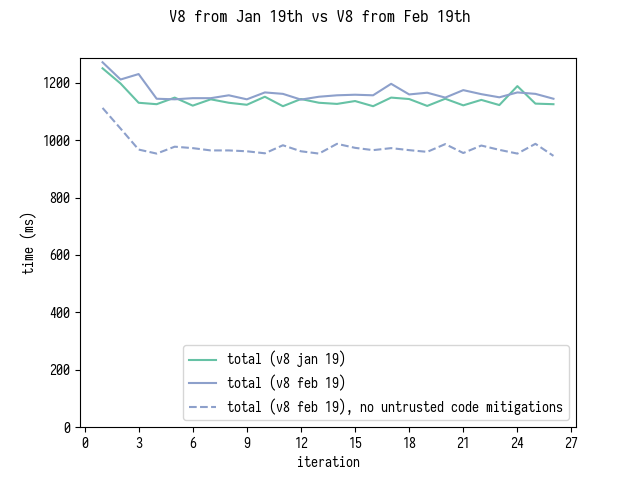
Finally a comparison of V8 from Jan 19th to V8 from Feb 19th with and without untrusted code mitigations.
Comparing to Oxidized source-map Version
Following the publication of this post on February 19th, I got few requests
to compare source-map with my tweaks against mainline oxidized source-map
that uses Rust and WASM.
Quick look at Rust source code for parse_mappings
revealed that Rust version does not collect or sort original mappings eagerly,
only equivalent of generatedMappings is produced and sorted. To match this behavior
I adjusted my JS version by commenting out sorting of originalMappings[i] arrays.
Here are benchmark results for just parsing (which also includes sorting generatedMappings)
and for parsing and then iterating over all generatedMappings.
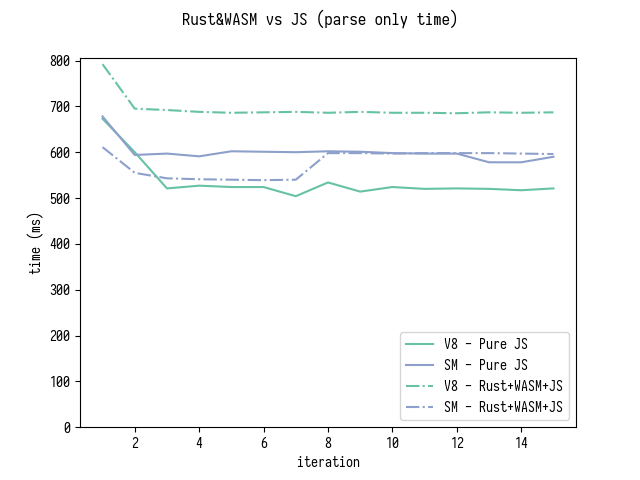
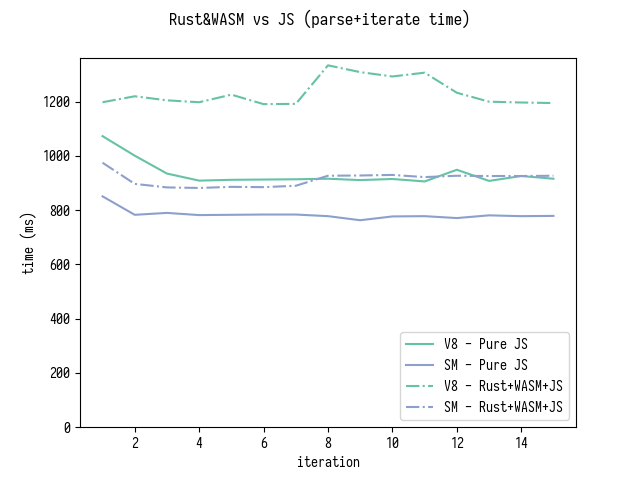
Note that the comparison is slightly misleading because Rust version does not
optimize sorting of generatedMappings in the same way as my JS version does.
Thus I am not gonna declare here that «we have successfully reached
parity with the Rust+WASM version». However at this level of performance
differences it might make sense to reevaluate if it is even worth the complexity
to use Rust in source-map.
Update (Feb 27th 2018)
Nick Fitzgerald, the author of source-map, has updated Rust+WASM version with
algorithmic improvements described in this article. Here is an amended
performance graph for parse and iterate benchmark:
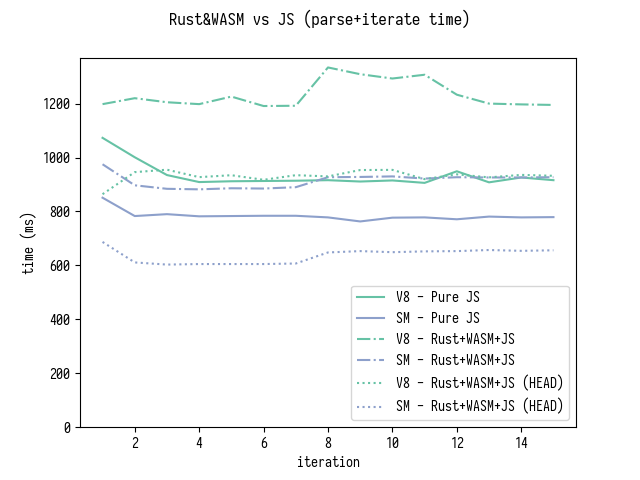
As you can see WASM+Rust version is now around 15% faster on SpiderMonkey and approximately the same speed on V8.
Learnings
For a JavaScript Developer
Profiler Is Your Friend
Profiling and fine grained performance tracking in various shapes and forms is
the best way to stay on top of the performance. It allows you to localize
hot-spots in your code and also reveals potential issues in the underlying
runtime. For this particular reason don’t shy away from using low-level
profiling tools like perf - “friendly” tools might not be telling you the
whole story because they hide lower level.
Different performance problems require different approaches to profiling and visualizing collected profiles. Make sure to familiarize yourself with a wide spectrum of available tools.
Algorithms Are Important
Being able to reason about your code in terms of abstract complexity is an important skill. Is it better to quick-sort one array with 100K elements or quick-sort 3333 30-element subarrays?
A bit of handwavy mathematics can guide us (\(100000 \log 100000\) is 3 times larger than \(3333 \times 30 \log 30\)) - and the larger your data is the more important it usually is to be able to do a tiny bit of mathematics.
In addition to knowing your logarithms, you need to posses a healthy amount of common sense and be able to evaluate how your code would be used on average and in the worst case: which operations are common, how the cost of expensive operations can be amortized, what the penalty for amortizing expensive operations?
VMs Are Work in Progress. Bug Developers!
Do not hesitate to reach out to developers to discuss strange performance issues. Not everything can be solved just by changing your own code. The Russian proverb says «It’s not gods who make pots!». VM developers are people and just like all others they make mistakes. They are also quite good at fixing those mistakes once you reach out to them. One mail or chat message or a DM might save you days of digging through foreign C++ code.
VMs Still Need a Bit of Help
Sometimes you need to write low-level code or know low-level details to squeeze the last drops of that performance juice out of JavaScript.
One could prefer a better language level facilities to achieve that, but it remains to be seen if we ever get there.
For a Language Implementor/Designer
Clever Optimizations Must be Diagnosable
If your runtime has any sort of built-in clever optimizations then you need to provide a straightforward tool to diagnose when these optimizations fail and deliver an actionable feedback to the developer.
In the context of languages like JavaScript this at minimum means that tools like profiler should also provide you with a way to inspect individual operations to figure out whether VM specializes them well and it it does not - what is the reason for that.
This sort of introspection should not require building custom versions of the VM with magic flags and then treading through megabytes of undocumented debug output. This sort of tools should be right there, when you open your DevTools window.
Language and Optimizations Must Be Friends
Finally as a language designer you should attempt to foresee where the language lacks features which make it easier to write well performing code. Are your users on the market for a way to layout and manage memory manually? I am sure they are. If your language is even remotely popular users would eventually succeed in writing code that performs poorly. Weight the cost of adding language features that fix performance problems against solving the same performance problems by other means (e.g. by more sophisticated optimizations or by asking users to rewrite their code in Rust).
This works the other way around too: if your language has features make sure that they perform reasonably well and their performance is both well understood by users and can be easily diagnosed. Invest in making your whole language optimized, instead of having a well performing core surrounded by poorly performing long tail of rarely used features.
Afterword
Most optimizations we discovered in this post fall into three different groups:
- algorithmic improvements;
- workarounds for implementation independent, but potentially language dependent issues;
- workarounds for V8 specific issues.
No matter which language you write in you still need to think about algorithms. It is easier to notice when you are using worse algorithms in inherently “slower” languages, but just reimplementing the same algorithms in a “faster” language does not solve the problem even though it might alleviate the symptoms. Large part of the post is dedicated to optimizations from this group:
- sorting improvements achieved by sorting subsequences rather than the whole array;
- discussions of caching benefits or lack of them there-off.
The second group is represented by the monomorphisation trick. Performance suffering due to polymorphism is not a V8 specific issue. Neither it is a JS specific issue. You can apply monomorphisation across implementations and even languages. Some languages (Rust, actually) apply it in some form for you under the hood.
The last and most controversial group is represented by argument adaptation stuff.
Finally an optimization I did to mappings representation (packing individual objects into a single typed array) is an optimization that spans all three groups. It’s about understanding limitations and costs of a GCed system as whole. It’s also about understanding strength of existing JS VMs and utilizing it for our advantage.
So… Why did I choose the title? That’s because I think that the third group represents all issues which should and would be fixed over time. Other groups represent universal knowledge that spans across implementations and languages.
Obviously each developer and each team are free to choose between spending N
rigorous hours profiling and reading and thinking about their JavaScript code,
or to spend M hours rewriting their stuff in a language X.
However: (a) everybody needs to be fully aware that the choice even exists; and (b) language designers and implementors should work together on making this choice less and less obvious - which means working on language features and tools and reducing the need in “group №3” optimizations.
Want to discuss
contents of this post? Drop me a mail [email protected] or find me on
Mastodon,
X or Bluesky.