[The title of this post is intentionally a bit misleading - it should be Browser as an Interactive Disassembly Exploration Tool but that’s way too confusing]
Due to the nature of my work I often have to dig through disassembly listings. Usually these are spat out by a compiler I’m working or worked on, which makes it easy to recognize familiar patterns and reconstruct the flow of the program. Assemblers and disassemblers built into V8 and Dart VM additionally support embedded comments which makes reading their output even easier. However from time to time I have to read the code produced by a compiler I only have a passing familiarity with, for a example to find and work around a bug or to better understand optimizations another compiler is capable of.
It might seem backwards to start reviewing an optimization performed by some open-source compiler from the code it generates instead of locating it in the source and understanding the whole pass in all its generality. However compilers rarely resemble elegant and slick machines, they are more akin to mossy steam-powered walking castles, a congregation of towers, parapets, turrets and bridges that grew around a once simple core and now is driven forward by a mess of pipes, pistons, boilers, valves, rods, wheels and gears. It’s impossible to navigate the maze of a compiler’s implementation unless you have a lot of free time to spend inside, running some errands together with its maintenance crew.
Reading a compiler’s output is much easier as you are often helped by the fact that most compilers only exist to optimize your code. They might move you code around, decompose and recombine it in unexpected ways but unlike packers they are not going to waste CPU cycles to try and purposefully muddle the control and data flow inside it. The code produced by a compiler is usually well-behaved: it uses well-defined calling conventions, keeps the stack balanced, does not self-modify at all or limits self-modification to certain sites.
A couple of weeks ago I became interested in what kind of code HotSpot’s C2 compiler (aka “opto”, aka “server compiler”) produces for the loop below
// Full code at https://gist.github.com/tatumizer/2f8dd726529101d559c4
class SmallMap {
  int[] hashCodes = new int[MAX_ENTRIES];

  int _findIndex(int hashCode) {
    for (int i = 0, j = currentSize - 1; j >= i; i++, j--) {
      if (hashCodes[i] == hashCode) return i;
      if (hashCodes[j] == hashCode) return j;
    }
    return -1;
  }
}
This post documents a journey that started with a disassembly for this function and went sideways: with me implementing an interactive toy tool for disassembly exploration in the browser.
You can play with the resulting tool called Saga (which is more like a larvae of a tool) here. It’s source is currently inside IRHydra repo. If you are just curious to learn what C2 did to the loop above skip to the very end of the post.
Getting the disassembly out of HotSpot
This is the easiest part. All you need is to get or to build the external disassembler library hsdis, place it somewhere JVM can find it (e.g. add its location to LD_LIBRARY_PATH) and run with -XX:+UnlockDiagnosticVMOptions -XX:+PrintAssembly command line flags. If you are like me and have your brain hardwired to Intel assembly syntax then you’ll certainly also appreciate the existence of the -XX:PrintAssemblyOptions=intel option.
You will see disassembly listings for all compiled/optimized methods scrolling past you on the console, looking like this:
Decoding compiled method 0x0000000108841590:
Code:
[Entry Point]
[Constants]
  # {method} {0x00000001218404e0} '_findIndex' '(I)I' in 'javabench/SmallMap'
  # this:     rsi:rsi   = 'javabench/SmallMap'
  # parm0:    rdx       = int
  #           [sp+0x40]  (sp of caller)
  0x00000001088416e0: mov    0x8(%rsi),%r10d
  0x00000001088416e4: shl    $0x3,%r10
  0x00000001088416e8: cmp    %r10,%rax
  0x00000001088416eb: jne    0x0000000108761b60  ;   {runtime_call}
  0x00000001088416f1: data32 xchg %ax,%ax
  0x00000001088416f4: nopl   0x0(%rax,%rax,1)
  0x00000001088416fc: data32 data32 xchg %ax,%ax
[Verified Entry Point]
  0x0000000108841700: mov    %eax,-0x14000(%rsp)
  0x0000000108841707: push   %rbp
  0x0000000108841708: sub    $0x30,%rsp         ;*synchronization entry
                                                ; - javabench.SmallMap::_findIndex@-1 (line 15)

  0x000000010884170c: mov    %edx,0x4(%rsp)
  ; ----------------- ✂ -----------------
  ; full code of this method at
  ;   https://github.com/mraleph/irhydra/blob/master/saga/web/code.asm
At this point I usually would take a pen and piece of paper to track the control and data flow within the compiled method and just dive into it. But that evening was gloomy, GAS syntax looked more unpleasant than usual and brief inspection of the control flow inside the method revealed three loops instead of a single one I expected to see.
I pondered at this for a bit and suddenly realized that the best way to verify that loops are not tripling in my eyes is to let a machine do what it does best - extract control flow graph from the assembly and draw it for me.
I already had a control flow graph display component done as part of my IRHydra project, so I just needed to parse the disassembly listing.
“Everybody stand back. I know regular expressions.”
Control flow graph (CFG) consists of basic blocks — chunks of code with a single entry and single exit, connected with control flow edges.
This definition makes CFG reconstruction algorithm obvious:[This is an approximation, e.g. we are purposefully ignoring exceptional control flow.]
- find all control flow instructions (jumps, returns), these are always last instructions in a block: a block can only have a single exit which means a jump can’t jump from inside the block.
- find all instructions that are targets of some jump or immediately follow a control flow instruction - these start a block.
For example:
; B0
0x108841774: ...
0x108841779: ...
0x10884177e: je     0x108841792 ; jump to B4 or
                                ; fall through to B1
; B1
0x108841780: ...
0x108841783: ...
0x108841785: ...
0x108841787: jge    0x10884179e ; jump to B5 or
                                ; fall through to B2
; B2
0x108841789: ...
0x10884178e: jmp    0x108841792 ; jump to B4
; B3
0x108841790: ...
                                ; fall through to B4
; B4
0x108841792: ...
0x108841796: ...
0x108841797: ...
0x10884179d: retq
; B5
0x10884179e: ...
Building a graph based on this algorithm is a trivial question of coding:
final reInstruction = new RegExp(r"  0x([0-9a-f]+): ((j\w+)\s+0x([0-9a-f]+)|retq)?");

// Array containing a mixture of block-entry addresses and
// block-exit instructions all represented as 1, 2, or 3 element lists:
//
//   [addr]                block entry
//   [addr, "retq"]        return instruction
//   [addr, "jcc", target] jump (jcc)
//
final boundaries = [];

var startBlock = true;  // First instruction starts method entry block.
for (var m in reInstruction.allMatches(text)) {
  if (startBlock) {  // Do we need to start a block?
    boundaries.add([m.group(1)]);
    startBlock = false;
  }

  final blockExit = m.group(2);
  if (blockExit != null) {
    final addr = m.group(1);
    if (blockExit == "retq") {
      boundaries.add([addr, "retq"]);
    } else {
      final target = m.group(4);
      boundaries.add([addr, m.group(3), target]);
      boundaries.add([target]);
    }
    startBlock = true;
  }
}

// Sort boundaries so that they are ordered by address and
// block entries always come before block exits.
boundaries.sort((a, b) {
  if (a[0] == b[0]) {  // Same address?
    return a.length - b.length;
  }
  return a[0].compareTo(b[0]);
});

// Blocks by their address.
final blocks = <String, BB>{};
getBlock(addr) =>
  blocks.putIfAbsent(addr, () => new BasicBlock());

var currentBlock, entryAddr;
for (var boundary in boundaries) {
  if (boundary.length == 1) {  // Block entry?
    if (boundary[0] == entryAddr) {
      // Same entry, ignore.
      continue;
    } else {  // Start new block.
      final succ = getBlock(entryAddr = boundary[0]);
      if (currentBlock != null) {
        // If currentBlock is not null this means it falls through
        // into a new block.
        currentBlock.addSuccessor(succ);
      }
      currentBlock = succ;
    }
  } else if (boundary.length == 2) {  // Block exit: retq
    addr = block = null;  // Return, do not fall through.
  } else {
    block.addSuccessor(getBlock(boundary[2]));
    if (boundary[1] == "jmp") {
      // Unconditional jump, do not fall through
      addr = block = null;
    }
  }
}
However when I ran this code over the disassembly and displayed the resulting CFG on IRHydra’s graph_pane, it looked even more confusing than the disassembly itself:

The most confusing thing here is not even the completely unreadable mess of control flow edges, but the intense red color assigned to some blocks. IRHydra uses a Brewer palette to indicate loop nesting: deeper nested loops are colored in more intense red. The way it selected colors here indicates that there is a loop of nesting 3 (blocks B14, B15, B16, B17). However even a quick glance on the disassembly reveals a strange thing: these blocks indeed form a loop, but they are not nested within any other loop. What’s going on?
Turns out that instead of a generic loop finding algorithm IRHydra was using a heuristic targeting the specific shape of Dart VM and Crankshaft graphs and it failed to correctly identify loops in the CFG reconstructed from C2 generated code. The obvious next step was to replace the heuristic with some well known loop finding algorithm, for example one devised by Paul Havlak in his paper “Nesting of reducible and irreducible loops”. By a lucky coincidence this algorithm was once used as a cross-language benchmark and already has an implementation in Dart.
With the loop finding heuristic replaced the graph reshapes into something much closer to my initial expectations:

There is still one surprising thing on this graph: I expected to see three independent loops, but there is a fourth one at the very bottom and it seems to be infinite - there are no edges leaving it, only edges coming into it. Lets take a look at the disassembly corresponding to this loop:
# ...
  cmp    %ebx,%eax
  jae    B31
# ...
  cmp    %ebx,%eax
  jae    B33
# ...
B31:
  mov    %eax,%ebp

B32:
  mov    $0xffffffe4,%esi
  mov    %edi,(%rsp)
  mov    %r8,0x8(%rsp)
  mov    %r9d,0x10(%rsp)
  xchg   %ax,%ax
  callq  0x0000000108720ee0
  callq  0x0000000107c59080  # *iaload
                             # - javabench.SmallMap::_findIndex@31 (line 17)
                             #   {runtime_call}

B33:
  mov    %eax,%ebp
  jmp    B32
It’s impossible to derive this purely from the disassembly but these cmp/jae pairs look suspiciously similar to array bounds checks: unsigned comparison (jae - jump if above or equal) is used to simultaneously check if the index is nonnegative and is less than the array’s length.
If we assume that these are indeed bounds checks then one of those two calls at the end of B32 (most likely the second one) is either a throw or an uncommon trap (a deoptimization). In either case control would never return back from it which means it should be treated similarly to retq as a block exit.
Of course I could just add recognition of this call target to my mighty regular expression based parser and reconstruct the CFG once again, but this leads us to a very important realization: there is always a limit to how much machine can recognize by itself, especially given an incomplete disassembly listing.
Interactivity
A control-flow graph brings us only so much closer to understanding what kind of optimizations happened. Ideally when reading disassembly I would like to be able to hover over register names and see where the value contained in it can be coming from. Here is a live demo of what I want to achieve:
Essentially I want to compute something known as use-def chains.
Parsing
Before I can start building use-def chains I need to parse the disassembly listing completely down to the individual operands of each instruction. The regexp based “parser” was just recognizing jumps and retq.
My favorite way of writing parsers is parsing combinators so I decide to go with petiteparser which is a Dart version of PetiteParser - a parser library originally developed by Lukas Renggli for Pharo Smalltalk. Here is how a parser for operand looks like:
import 'package:petitparser/petitparser.dart' as p;

final anImmediate = (p.char(r"$") & aHexValue)
    .flatten().map((value) => new Imm(value));

final anOperand = aRegister
                | anImmediate
                | (aHexValue & anAddrMode.optional()).map((addr) {
                    final offset = addr[0];
                    final base = addr[1];
                    return new Addr.withOffset(base, offset);
                  })
                | anAddrMode;
After the disassembly is parsed we would run an algorithm already described above to get the CFG out of it, yielding the following structure:
class BasicBlock {
  final List<Instruction> code;

  final List<BasicBlock> successors;
  final List<BasicBlock> predecessors;
}

class Instruction {
  final opcode;
  final operands;
  final comment;
}
Now we need to establish relations between instruction’s operands and values that are potentially flowing into them from other instructions.
Intermediate Representation.
Instead of working directly with instructions we are going to build a separate data-flow graph on the side:
class Node {
  Instruction origin;  // Original assembly instruction.

  final op;
  final List<Use> inputs;

  final List<Use> uses;  // List of Use-s that reference this node:
                         // every use on this list satisfies use.def == this.
}

class Use {
  final Node at;
  final int idx;
  Node def;
}
Each node represents an operation performed on its inputs and inputs are always values produced by some other nodes. Every node also keeps a list of places where it is being used so that for example if you need to get the list of nodes using a given node you can just do node.uses.map((use) => use.at).[In some sense inputs and uses in the data-flow graph are the same as predecessors and successors of the control-flow graph.]
Here is an example of how a DFG could look like for a simple piece of disassembly:
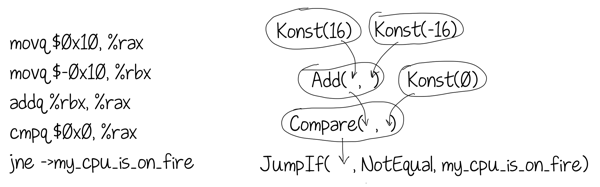
But what if at some point in the program a register contains a value that does not have a unique definition, e.g. it could be produced by several different instructions depending on the execution path taken? A simplest example would be a conditional x = f ? 1 : 2.
Here are we again going to steal a page from a compiler construction handbook and use an abstraction called phi-functions (also known as φ-functions in ancient Greece) used in Single Static Assignment form. A phi-function represents a data-flow merge that occurs at a control-flow merge point. Given a block with N predecessors a phi-function inside that block would also have N inputs. When “executed”, the phi-function essentially looks at where control came from into its block and returns the value of the input corresponding to that predecessor.
Consider the following example:[A sane optimizing compiler is unlikely to generate this kind of messy machine code from the simple ternary expression above. I just wanted to keep the example simple. For example LLVM would avoid branches by generating
cmpq $1, %rax
movl $1, %ebx
adcq $0, %rbx]
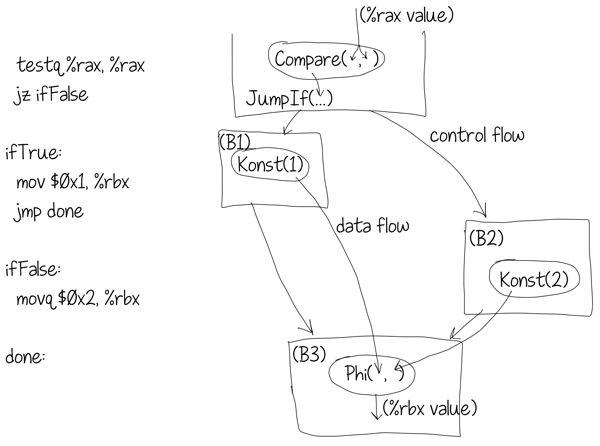
Here the block B3 has two predecessors B1 and B2. At the end of B1 the register %rbx contains the constant 1. At the end of B2 the same register %rbx contains the value 2. This means that at the beginning of B3 this register contains either 1 or 2 depending on where control came from into B3. This is captured by a phi-function with two inputs: Konst(1) coming from B1 and Konst(2) coming from B2.
Decompiling into IR.
How do we build our data-flow graph from the instructions? We are going to interpret them. However instead of yielding actual values our interpretation will yield node (or nodes) capturing semantics of the instruction we execute. This is similar to abstract interpretation though the associated formalism is completely unnecessary here.
Lets take a look at how this could work for the add instruction, assuming that we only wanted to support the addq %src, %dst variant:
class AbstractInterpreter {
  final registers = new SSABuilder();

  get semantics => {
    // addq %src, %dst semantics is simple: compute sum of values from
    // registers %src and %dst, store it into the register %dst and
    // update FLAGS register according the result. The code below
    // does precisely that, but instead of performing computations
    // on the actual integer values it produces a graph of Nodes
    // which when executed would produce the same value.
    "add": (src, dst) {
      final rhs = use(src);
      final lhs = use(dst);
      final res = Node.binary(ADD, lhs, rhs);
      define(dst.reg, res);
      define(CpuRegister.FLAGS, Node.flags(res));
    }
  };

  // Set the current value of the register [reg] to [value].
  define(reg, Node value) =>
    registers.assign(reg, value);

  // Get the current value of the register referenced by [srcRef] and
  // remember what [srcRef] resolved to.
  Node use(src) =>
    registers.valueOf(src);
}
The actual code is more complicated because it would also need to support immediate operands, memory operands and different operand sizes. It also needs to track relationships between the original Instruction operands and the Node objects they resolve too.
To decompile the instruction stream into IR we just execute them block by block, instruction by instruction. The SSABuilder class which we are using to store registers state also keeps track of the flow of values between blocks and inserts phis when necessary. When all blocks are visited we eliminate redundant phi-functions. This is essentially the same algorithm Crankshaft uses for on-the-fly SSA-form construction. For implementation details check either the sources or a paper describing a similar algorithm “Simple and Efficient Construction of Static Single Assignment Form”.
Optimizing IR for readability.
After data-flow graph is constructed we can use the computed information to show the flow of values between instructions in the disassembly. But what if I don’t want to read disassembly at all? Maybe I could read IR instead?
Lets take a look at the IR we computed for the block B2, which was already featured above:
B2:v47 <- v30 - v39 v48 <- flags(v47) v49 <- r12 + v37 * 8 + 0 v51 <- v47 - 1 v52 <- flags(v51) v53 <- if v52.lt then 1 else v47 v54 <- v53 - v39 v55 <- flags(v54) v56 <- if v55.gt then v39 else v53 goto B3
Turns out reading IR is even more unpleasant than the disassembly it was computed from:
- it contains dead code e.g. flags computations that are never used;
- it contains low level idioms e.g. computing flags and then branching on them;
- it contains HotSpot idioms in their lowered form e.g.
v49is a compressed oop unpacking, but to see that you need to know how compressed oops work.
Compiler engineers know that if you have a problem with your IR, then you can always solve it by adding yet another optimization pass (or another IR). This, by the way, is why I decided to use IR in the first place instead of computing UD-chains over the instructions themselves: having a separate IR allows me to modify it as I please - while still having the original instructions and use-def relations for them on the side.
Dead Code Elimination
If an IR node has no side effects and no uses then remove it from the IR. Check if any inputs become dead. Rinse. Repeat. The simplest implementation does not handle cycles in the data flow graph, but those should have been cleaned by C2 itself in the first place. We are mostly trying to get rid of unused flags(...) which we ourselves produced.
Fuse conditionals
Find all OpBranch and OpSelect instructions (aka ternary expressions) and fuse them with operations that compute the flags for them.
This optimization turns
v51 <- v47 - 1
v52 <- flags(v51)
v53 <- if v52.lt then 1 else v47
into
v286 <- if v47 < 1 then 1 else v47
which, as attentive reader will notice, can be further folded into
v287 <- max(v47, 1)
by a separate folding rule.
Forwarding spills
Now lets take a look at a different block:
B4:v68 <- v49 + v59 * 4 + 16 v69 <- *v68 v71 <- v25 + 4 v72 <- *v71 if v69 == v72 then B9 else B5
Again this is harder to read than the disassembly: I would like to see the actual value that was spilled onto the stack by the register allocator instead of seeing a load from the stack.
Turns out, the C2 generated code uses fixed-size frames so a very straightforward store-to-load forwarding pass for all rsp relative pointers easily fixes the IR for us:
B4:v68 <- v49 + v59 * 4 + 16 v69 <- *v68 if v69 == parm0 then B9 else B5
Typing loads
The load v69 from the block B4 above is quite obviously a load from an int array but Saga can’t figure it out unless it figures out that v49 yields a pointer to int[]. Here is the whole dependency chain for this value (it actually spans several blocks):
v36 <- this + 20
v37 <- *v36
v49 <- r12 + v37 * 8 + 0
v68 <- v49 + v59 * 4 + 16
v69 <- *v68
The disassembly header tells us that this is an instance of javabench.SmallMap:
# this: rsi:rsi = 'javabench/SmallMap'
but it does not contain any information about its layout which prevents us from determining what *(this + 20) means.
As you’ve probably heard before in Java most problems usually have three letter solutions. This one is not an exception: a tool called JOL can fetch the object layout information for you using dark arts of sun.misc.Unsafe.
Here is what it prints for javabench.SmallMap:
javabench.SmallMap object internals:
 OFFSET  SIZE     TYPE DESCRIPTION                    VALUE
      0    12          (object header)                N/A
     12     4      int SmallMap.currentSize           N/A
     16     4 Object[] SmallMap.keys                  N/A
     20     4    int[] SmallMap.hashCodes             N/A
     24     4 Object[] SmallMap.values                N/A
     28     4      Map SmallMap.fallbackMap           N/A
Instance size: 32 bytes (estimated, the sample instance is not available)
That’s precisely the information we were missing. Now it’s a question of
- prepending this to the disassembly listing;
- throwing together a simple parser for this;
- running a simple type propagation analysis over the IR.
Loads in question transform into:
v344 <- this.hashCodes
v342 <- unpack(v344)
v347 <- v342[v59]
Now this is way more readable than original disassembly!
UI touches
It’s pretty hard to figure out the best way to render data-flow graph: e.g. should a node be given a name or should it be displayed inline within another node? Instead of trying to solve this in a generic way I decided to make it possible to inline and un-inline nodes with a single click.
Another hard problem is giving meaningful names to individual nodes, it is impossible to do it automatically. That’s why any node can be renamed with a double-click.
Here is a fragment of the Saga UI for IR:
- try double clicking on the node name to rename it;
- try hovering over nodes below and clicking on ▼ and ▲ markers;
Calls that throw
As I mentioned before Saga has no way of figuring out whether the call it sees returns normally or always throws. That’s why the disassembly view has support for tweaking call-target attributes:
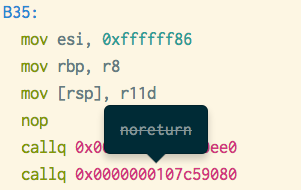
Marking a call noreturn tells the CFG reconstruction algorithm to assume that this calls never returns. As an experiment I also decided to assume that paths that lead to noreturn calls are exceptional and unlikely. Once all analysis/optimization passes over IR are completed, we fuse blocks together by ignoring conditional branches that lead to unlikely paths: e.g. if B1 has likely successor B2 and unlikely successor B3 and B2 has a single predecessor we fuse B1 and B2.
Here is a CFG after such fusion (dashed edges are unlikely ones):

What did C2 do to that loop?
Ok, we have a tool that allows us to navigate IR in various ways. Maybe it’s time to figure out what C2 did to that loop and why there are three loops in a method that only had one loop to begin with?
If we inspect the bodies of these three loops we will find that the middle one has no array bounds checks inside while the pre loop and post loop have these checks. What C2 did here is the Range Check Elimination optimization that splits the loop iteration space into three parts in such a way that main loop (one in the middle) does not need to perform array bounds checks.
We start with a loop like this:
for (int i = 0, j = currentSize - 1; j >= i; i++, j--) {
  if (hashCodes[i] == hashCode) return i;
  if (hashCodes[j] == hashCode) return j;
}
return -1;
Which after some optimizations (e.g. expressing j through i) starts to look more like this:[Keep in mind that C2 operates on a representation called _sea-of-nodes_ so when I say "look like this" I actually mean "look like this in a very loose sense of word like".]
int S = currentSize;
if (S - 1 < 0) return -1;

int L = hashCodes.length;
for (int i = 0; ; i++) {
  int j = S - 1 - i;
  if (i < 0 || i >= L) throw new ArrayIndexOutOfBoundsException();
  if (hashCodes[i] == hashCode) return i;
  if (j < 0 || j >= L) throw new ArrayIndexOutOfBoundsException();
  if (hashCodes[j] == hashCode) return j;
  if (j - 1 < i + 1) return -1;
}
As far as I can guess C2 thinks that the iteration space of this loop is [0, L) so it splits it into three loops:
- a pre-loop going from
0tomin(max(S - L, 1), L). - a main-loop continuing from there to
min(S, L) - a post-loop continuing from there to
L.
These bounds mean that the body of the main loop is executing only for values of i such that 0 <= max(S - L, 1) <= i < min(S, L). This immediately yields S > 0. (note: S - 1 > 0 checked before the loop does not imply S >= 0 as S - 1 could have overflowed if S = INT_MIN).
i >= max(S - L, 1)impliesi >= S - L. This impliesi > S - L - 1, which in turn impliesS - 1 - i < L. This derivation only holds becauseS > 0which meansS - 1 - ican’t underflow.- if
i < min(S, L)theni < Landi < S. The second inequality impliesi <= S - 1(this holds becauseS - 1can’t underflow). This implies0 <= S - 1 - i.
In other words we have shown that 0 <= S - 1 - i < L. 0 <= i < L is obvious. This means the main loop can skip both range checks.
Ultimately for this particular loop it removes only one conditional branch because after this optimization the loop still checks both, the old loop condition i <= j and a new artificial loop condition i < min(S, L). Another funny thing is that in the post-loop that goes up to L we still perform the bounds check on i even though it should not be necessary (though that does not really matter as in the well behaved code most of the time should be spent in the main loop anyway). I suspect that this optimization works better when the original loop condition has a loop invariant limit.
[Anybody who is more familiar with HotSpot internals should correct me if I am wrong in my reasoning above, as I only glanced through do_range_check phase in C2 sources but that’s too much code to grasp it quickly]
For curious here is the full method as it can be seen in Saga after some renaming.
Want to discuss
contents of this post? Drop me a mail [email protected] or find me on
Mastodon,
X or Bluesky.