Sometimes when I search for “jsperf” on Twitter and click through to see some test cases I immediately remember a saying usually attributed to Confucius:
“The hardest thing of all is to find a black cat in a dark room, especially if there is no cat.”
I like to imagine him rephrasing this saying if Confucius were into JavaScript microbenchmarking himself:
“The hardest thing of all is to find which operation is more expensive inside the darkness of VM, especially when no operation is performed.”
Sound of silence
Today I would like to look on a benchmark that David Nolen recently shared on Twitter.
probably shouldn't be surprised anymore but JavaScript perf today is incredible, Murmur3 here we come http://t.co/uttbhoyfWV #clojurescript
— David Nolen (@swannodette) February 20, 2014While I do agree with David that JavaScript performance these days is nothing short of amazing, I think we should start approaching it as such in our measurements as well. Which implies that we should start assuming that our code is often optimized and amazingly often is even optimized away.
Lets take a quick look at the baseline case from his benchmark:
// I am using Benchmark.js API as if I would
// run it in the d8.
Benchmark.prototype.setup = function() {
  function multiply(x,y) {
    return x*y;
  }
};

var suite = new Benchmark.Suite;
suite.add('multiply', function() {
  var a = Math.round(Math.random()*100),
      b = Math.round(Math.random()*100);

  for(var i = 0; i < 10000; i++) {
     multiply(a,b);
  }
})
If you ever listen to my LXJS2013 talk or read any of my posts on microbenchmarks you should be feeling uneasy by now. This uneasiness is always based on a simple observation: “if I were a somewhat smart cyborg hired to compile people’s JavaScript code into machine language I would just throw whole loop away because it does no useful work, but simply wastes electricity and brings closer the heat death of the universe.”
Surely we have no cyborgs compiling our JavaScript, but is V8 smarter or dumber than a somewhat smart cyborg? Lets peek inside and decide that.
IRHydra2 as a spyglass
For the first time in the history of this blog I am not going to use a special standalone build of V8 to investigate IR produced by its optimizing compiler. Instead I am going to use IRHydra2 and Chrome Canary. Canary finally has a recent enough version of V8 and can produce enough information for IRHydra2 to work. Hooray!
To get the IR flowing out of Canary I launch it like this:
# make a temporary directory for V8 files
$ mkdir v8-artifacts && cd v8-artifacts
$ /Applications/Google\ Chrome\ Canary.app/Contents/MacOS/Google\ Chrome\ Canary \
     --no-sandbox                           \
     --js-flags="--trace-hydrogen           \
                 --trace-phase=Z            \
                 --trace-deopt              \
                 --code-comments            \
                 --hydrogen-track-positions \
                 --redirect-code-traces"    \
     http://jsperf.com/bit-multiply
Don’t browse with these flags! As you can see I am disabling sandbox to allow V8 write access to disc from the renderer process. Use them only for development and in trusted environment (which would also mean to never load anything over HTTP and yada-yada…).
After we run jsPerf case and close the browser, we can notice that V8 produced a number of files in the current directory:
$ ls -alh
total 14368
drwxr-xr-x   6 mraleph  staff   204B Feb 24 00:02 .
drwxr-xr-x  36 mraleph  staff   1.2K Feb 23 22:50 ..
-rw-r--r--@  1 mraleph  staff    13K Feb 23 23:11 code-65118-1.asm
-rw-r--r--@  1 mraleph  staff   267K Feb 23 23:11 code-65119-1.asm
-rw-r--r--@  1 mraleph  staff   352K Feb 23 23:11 hydrogen-65118-1.cfg
-rw-r--r--@  1 mraleph  staff   6.4M Feb 23 23:11 hydrogen-65119-1.cfg
Due to Chrome’s multiprocess architecture you might have multiple logs dumped: each Isolate inside each renderer/worker/extension process writes its own compilation log. IR goes into hydrogen-<pid>-<isolate-id>.cfg and deoptimization events and source code are dumped into code-<pid>-<isolate-id>.cfg. In my case jsPerf related events all went to 65119 files, so I took those and opened them in IRHydra.
Disappointing names
First disappointment that awaits you when you try to use IRHydra with jsPerf are uninformative names for functions that Benchmark.js dynamically generates to run your testcases. Method list greets you with something like this:
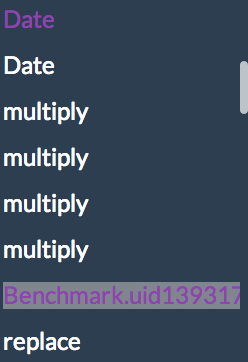
and immediately a question arises “Who is this uid1393… and what did he do to my test case?”. Fortunately it’s JavaScript all the way down so we can send our monkeys to patch some DOM operations that Benchmark.js uses. Just add
<script src="http://mrale.ph/irhydra/jsperf-renamer.js"></script>into “Preparation code HTML” section and if you are lucky it will do its magic by hooking into document.createElement and rewriting dynamically injected <script>-tags.
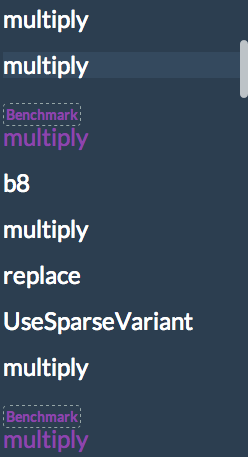
I rerun jsPerf case and now method list looks much more friendly:
Where is the loop?
If you are feeling lost in the sea of IR instructions just switch to the Graph pane and look for the reddest block you can find. The more intense the color - the deeper block’s loop nesting. Waaait. Why will our loop be nested? Well, if you ever looked at what Benchmark.js does inside (and if you use jsPerf you better should) then you know that it wraps test case you wrote into a loop and measures how many iterations per second that loop can do, thus it actually makes no sense to write your own loop inside jsPerf test cases… but we did which means our handwritten loop will be nested inside autogenerated loop.
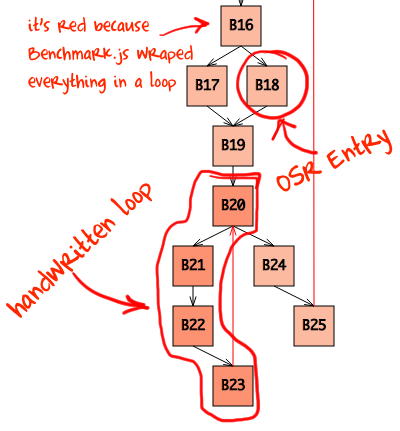
Now we know where to look at in the IR pane: V8 took our handwritten loop and made blocks B20-B23 out of it. Here they are:
B20
s439 Phi [ s420 s473 ]
     BlockEntry
     CompareNumericAndBranch LT s439 s446 goto (B21, B24)
293 compare-numeric-and-branch if [eax|R] < [constant:446] then B21 else B24

B21
    BlockEntry
    Simulate id=225
    Goto B22
297 goto B22

B22
     BlockEntry
     Simulate id=225
     StackCheck t406 changes[NewSpacePromotion]
     Simulate id=248 push t416, push t461, push i418, push i419
     EnterInlined multiply, id=4
     LeaveInlined
     Simulate id=246 pop 1
     Goto B23
300 stack-check = [stack:26]
303 goto B23

B23
     BlockEntry
s473 Add s439 s472 [-1073741823, 10000]
     Simulate id=221 var[17] = s473
     Goto B20
306 add-i [eax|R]= [eax|R] [constant:472]
309 goto B20
This looks a bit scary with all these cryptically named instructions in the block B22. But if we close our left eye and imagine that HIR (high-level representation, instructions on the white background) disappeared, then only LIR (low-level representation, instructions on the bluish background) will be left:
B20
293 compare-numeric-and-branch if [eax|R] < [constant:446] then B21 else B24

B21
297 goto B22

B22
300 stack-check = [stack:26]
303 goto B23

B23
306 add-i [eax|R]= [eax|R] [constant:472]
309 goto B20
LIR very closely describes the machine code that will be generated. Does it still look scary? I don’t think so. It is now completely obvious that multiplication that we were trying to benchmark is nowhere to be seen. Optimizer moved it somewhere and quite possible into the trash bin.
IR do you speak it?
Obviously not everybody wants to waste their time reading IR and trying to understand where compiler moved their code. Even I would prefer to just glance over the source tab in IRHydra2 and see which parts were optimized away… so I went and prototyped such a feature.
All required information is already there: each HIR instruction know which source position it originated from so you can just take all IR instructions, throw them onto the source and see where no instruction lands - those parts of the code were optimized away.
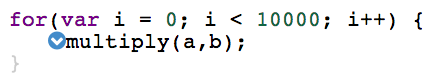
My prototype operates on the line granularity and here is how multiply looks in the source view now:
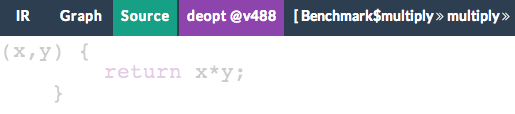
Reduced opacity indicates that no IR instruction has a source position falling on this line of code. In case of multiply function this means multiplication was completely DCEd, thrown into the trash bin, by the compiler because nobody needs its result. So far so good.
If we look at multiply’s caller a small confusion awaits us.
We know from looking at the IR that multiply was completely inlined (blue chevron indicates this as well) and its body was DCEd. Why is the line containing callsite not marked as dead? There are no instructions in the loop that were generated from it!
The keyword here is “loop”. Indeed no instructions were generated for this callsite in the loop. However there is one instruction generated outside of the loop, it’s a check verifying inlining target. It was originally inserted right before inlined body of multiply. The body itself was killed by DCE, but the guard stayed for correctness reasons and was hoisted out of the loop by LICM pass. If we look at the block B19 aka loop preheader we will discover this check there:
B19
t398 Phi [ t45  t375 ]
t401 Phi [ t48  t395 ]
t406 Phi [ t53  t383 ]
s409 Phi [ s69  s538 ]
t410 Phi [ t57  t387 ]
t411 Phi [ t58  t388 ]
i413 Phi [ i222 i539 ]
i414 Phi [ i365 i540 ]
s415 Phi [ s94  s541 ]
     BlockEntry
     Simulate id=212
s439 Constant 10000  [10000, 10000]
     CheckValue t411 0x379a84b1 {JS Function multiply}
t454 Constant 0x33c48355
     Goto B20
284  check-value = [edx|R]
287  goto B20
Mystery solved, but that does not make it less confusing, does it?
Marking moved code
There are various ways to approach this problem. The simplest one would be to record where each instruction was when IR was originally built and then compare where instructions ended up after the last phase. This would tell us how instructions moved and which instructions were eliminated.
I however decided to approach it differently: my ultimate goal for IRHydra2 is to annotate the source with as much information I could gather from the IR as possible. This means IRHydra should actually understand what JavaScript source is doing, where property accesses were, where conditions were and so on. This means it has to parse source it presents on the Source tab.
Thus I took Esprima and parsed. With the AST on my hands I can find original loops and see if any IR instructions actually jumped out of them. If all instructions falling on the source line were hoisted out of the immediately enclosing loop then such line will now be highlighted in a special way:
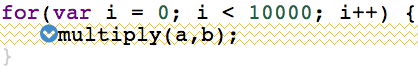
At last the picture makes sense (if you know what golden-zigzag means): only condition and update clauses of the loop are alive and everything else is either DCEd or LICMed. No meaningful code is produced from the closing curly brace } (what a surprise!).
As you can see I could not find a good way to highlight such lines e.g. I can’t reduce opacity because it will be confusing: as some instructions are still present, just hoisted. Suggestions are welcome.
Where do we go from here?
With the tool like this in your toolbox you can quickly check if stuff you are measuring is not completely optimized away. It does not mean that you should run and start microbenchmarking, because it is still hard to write a meaningful one. With IRHydra it’s just a bit easier to see that your benchmark is measuring weather instead of performance.
In the end you still have to study IR manually instruction by instruction to see if your microbenchmark is measuring what you need it to measure… and something tells me that this time would be better spent optimizing your application on the algorithmic level.
Happy optimizations!
Want to discuss
contents of this post? Drop me a mail [email protected] or find me on
Mastodon,
X or Bluesky.