Hello JavaScript programmers,
Look at this jsPerf test case.
Now back to me.
Now back at another revision of the same test case.
Now back to me.
Is it confusion that I see in your eyes?
Lets resolve it.
To keep this story short I will assume that you read my other posts about V8’s internals (at least this, this, this and this ) and have an idea about how inline caches, hidden classes and closures work in V8, how jsPerf benchmarks your code by generating a function from your test case code and why microbenchmarks are bad.
We start by throwing together a simple standalone test case that can be run in the d8 shell:
// Load top-of-the-tree versions of lodash and benchmark.js
load("lodash.js");
load("benchmark.js");

Benchmark.prototype.setup = function() {
  function ClosureColor(name) {
    // Have no choice but to add these methods to the instance
    this.getName = function () {
        return name;
    };
    this.setName = function (n) {
        name = n;
    };
  }
  var closureColor = new ClosureColor('green');

  function PrototypeColor(name) {
    this._name = name;
  }

  PrototypeColor.prototype.getName = function () {
    return this._name;
  };

  PrototypeColor.prototype.setName = function (n) {
    this._name = n;
  };

  var prototypeColor = new PrototypeColor('green');
};

var suite = new Benchmark.Suite;
suite
  .add('Closure', function () {
    var name = closureColor.getName();
    closureColor.setName('blue');
  })
  .add('Prototype', function () {
    var name = prototypeColor.getName();
    prototypeColor.setName('blue');
  })
  .on('cycle', function (event) { print(event.target); })
  .run();
The test case runs just fine and reports low variance which indicates that there is no problem with optimization being disabled for functions collecting timing samples:
∮ out/ia32.release/d8 test.js
Closure x 427,071,038 ops/sec ±1.14% (67 runs sampled)
Prototype x 332,008,541 ops/sec ±0.99% (65 runs sampled)
What in the name of adaptive compilation is going on here? Did not everyone including me tell before that it is better to use classical prototype pattern as this is what VM optimize for?
Diving into IR (take a deep breath)
Lets compare hydrogen IR that V8 generated for benchmarking loops in both cases
[I am stripping away some cruft in both cases to highlight the difference]
     ;; Closure case
B7
     CheckHeapObject t114        ;; (*)
t157 CheckMaps t114 [0x5ad083c9] ;; (*)
t158 Constant {FixedArray[5]}
     EnterInlined ClosureColor.getName
t161 LoadContextSlot t158[4]
v162 LeaveInlined
     Goto B8

B8
t168 Constant "blue"
v173 EnterInlined ClosureColor.setName
v174 StoreContextSlot t158[4] = t168 changes[ContextSlots]
v176 LeaveInlined
v178 Goto B9
     ;; Prototype case
B7
t156 CheckHeapObject t116        ;; (*)
     CheckMaps t116 [0x5ad1ab41] ;; (*)
t158 Constant {FixedArray[86]}
     EnterInlined PrototypeColor.getName
t163 LoadNamedField t116._name
     LeaveInlined
     Goto B8

B8
t170 Constant "blue"
     EnterInlined PrototypeColor.setName
     CheckMaps t116 [0x5ad1a989,0x5ad1ab41] ;; (?)
     StoreNamedField t116._name = t170
     LeaveInlined
     Goto B9
There are numerious code quality issues here:
- Checks marked as
(*)I would expect to be hoisted out of the loop via LICM because there is nothing in the loop body that could potentially affect them; - Instruction marked as
(?)I was not expecting to see at all. It’s a polymorphic check verifying that valuet116has either one of two hidden classes. It looks especially out of place because it is dominated by another less general map check so CSE should have eliminated it. This instruction is the main difference betweenClosureandPrototypecases.
Source of polymorphism
Actually I lied when I said that I was not expecting to see a polymorphic check at all. In fact previously, before John-David Dalton fixed mangling scheme used by Benchmark.js I was constantly seeing highly polymorphic test cases poping up.
To understand how interaction between jsPerf and V8 hidden classes can lead to a polymorphic code lets briefly remember a couple of things.
Hidden classes
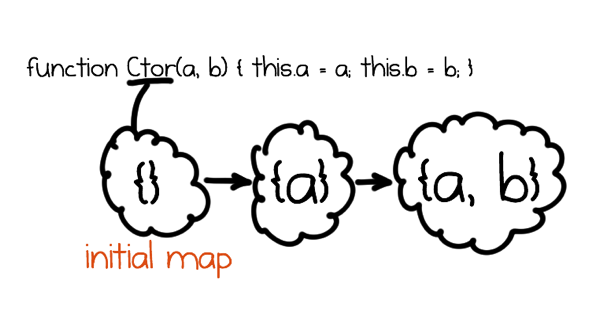
V8 uses hidden classes (called maps internally) to capture object structure as it’s shape is being mutated. Each hidden class fully describes object’s layout and contains additional information about it e.g. it points to object’s prototype. Object’s hidden class changes as new properties are being added to it. Individual hidden classes describing shapes that object went through are wired together with transitions so that runtime system could find them if some other object arrives to the same shape. This chain (or rather dag) of transitions usually starts at object’s constructor which carries around so called initial map. Different constructors carry different initial maps.
Important thing to understand from this is that the code below will produce objects with different hidden classes because their constructors are different closures.
function make() {
  function maker() { }
  return new maker();
}

var a = make(), b = make();
// a and b have different hidden classes because a new maker is created
// every time you execute make.
Inline Caches and Optimizing Compiler
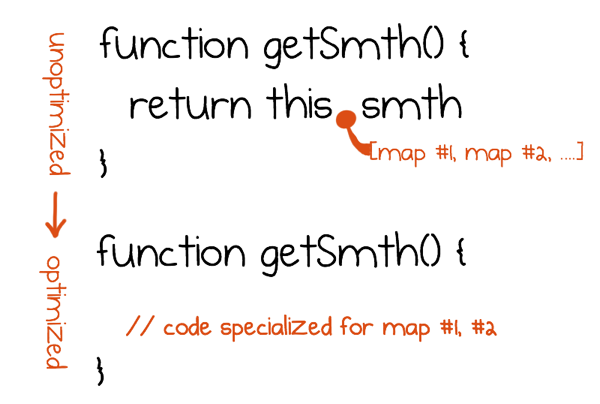
V8 has two separate compilers: a simple non-optimizing one (aka full) and an optimizing one. When code is compiled with a full compiler all operations with dynamic binding like property lookups get an inline cache (aka IC) that remembers what kind of objects it saw and adopts to them to ensure that the next time this IC sees the same kind of object it can perform operation quickly instead of figuring out what to do again. One thing to note here is that unoptimized code is shared by all instances of the same function literal which means that ICs and information collected by them is shared as well.
When the code becomes hot it gets recompiled with optimizing compiler that takes information collected by ICs and uses it to speculatively specialize code to handle only types that ICs saw. Specialization is guarded with checks that verify assumptions made optimizing compiler. After specialization compiler applies classical techniques (CSE, LICM and so on), which make code even faster by eliminating different redundancies: for example repetitive guards inserted on earlier stages or repetitive loads from the property that does not change.
Adding things together
To execute your test case Benchmark.js compiles it into a JavaScript code that looks approximately like this (I am intentionally writing certain things differently to highlight important parts):
function (N) {
  /* code from setup section is here */
  var start = Date.now();
  for (var i = 0; i < N; i++) {
    /* test case code is here */
  }
  var end = Date.now();
  /* code from teardown section is here */
  return (end - start);
}
In fact it generates multiple copies of this code each mangled using a unique identifier to prevent underlying JavaScript VM from caching optimized version. Each copy is used to obtain a single timing sample for a test case. As can be seen above Benchmark.js sampled 67 runs of Closure case which means it compiled 67 uniquely mangled versions of benchmarking function. However each of those functions was run not once but twice.
Before running generated function with a big number of iterations N Benchmark.js pretests it by executing it with N = 1.
Now the source of polymorphism is apparent: by executing benchmarking function twice, we executed setup section twice which each time produced objects with different hidden classes. Essentially hidden classes from pretest have flown into ICs and “polluted” them.
Wait! Why do we have both poly- and mono- checks?
The truth is some ICs (for property loads and calls) do not record the type of the very first object they see. When such IC is used for the first time it flips to a so called premonomorphic state and does not record the type it saw, only the next observed object will be recorded. Other ICs (for example ones used for stores) do not have premonomorphic state and start recording types immediately.
For our benchmark it means that pretest run transitions all load and call ICs into premonomorphic state while a store IC in PrototypeColor.prototype.setName becomes monomorphic. The benchmarking function is run the second time load and call ICs become monomorphic, but the store IC becomes polymorphic because it saw two distinct hidden classes. On the other hand ClosureColor.prototype.setName does not contain a store IC at all because context variable access in the absence of eval is not dynamically bound and is statically resolved by scope analysis even before optimizing compilation.
Here is an excerpt from the log generated by debug build of d8 with --trace-ic flag.
∮ out/ia32.release/d8 --trace-ic test.js
              ---✂---
// Closure case pretest run, calls to getName/setName are executed
// for the first time and become premonomorphic (.). No ICs inside functions.
[CallIC in +370 at <unknown>:28 (0->.)#getName]
[CallIC in +394 at <unknown>:29 (0->.)#setName]
              ---✂---
// Closure case real run, calls to getName/setName are executed
// more and become monomorphic (1). No ICs inside functions.
[CallIC in +370 at <unknown>:28 (.->1)#getName]
[CallIC in +394 at <unknown>:29 (.->1)#setName]
              ---✂---
// Prototype case pretest run, calls to getName/setName are executed
// for the first time and become premonomorphic. getName contains a load IC
// which becomes premonomorphic as well. setName has store IC which becomes
// monomorphic.
[CallIC in +370 at <unknown>:28 (0->.)#getName]
[LoadIC in PrototypeColor.getName+33 at <unknown>:20 (0->.)#_name]
[CallIC in +394 at <unknown>:29 (0->.)#setName]
[StoreIC in PrototypeColor.setName+35 at <unknown>:24 (0->1)#_name]
              ---✂---
// Prototype case real run, previously premonomorphic ICs become
// monomorphic. Store IC inside setName on the other hand becomes
// polymorphic (P).
[CallIC in +370 at <unknown>:28 (.->1)#getName]
[LoadIC in PrototypeColor.getName+33 at <unknown>:20 (.->1)#_name]
[CallIC in +394 at <unknown>:29 (.->1)#setName]
[StoreIC in PrototypeColor.setName+35 at <unknown>:24 (1->P)#_name]
Why mono-check does not subsume poly-check?
I was expecting CheckMaps x, [A] instruction to fully subsume any dominated CheckMaps x, [A, ...] instruction. However such optimization is simply not implemented in V8 at this moment.
Why inserted checks are not hoisted?
This is a more interest question. V8 has a loop invariant code motion pass. Checks are obviously invariant, as nothing changes object’s hidden classes in this loop. Why didn’t LICM move them out?
After spending some time with debug printf’s I managed to figure out that this is a bug in the interaction between on-stack-replacement, graph building and LICM:
- we decide to optimize benchmarking function while it is still running (which is a wise decision as it will be run only once with big iteration count);
- when building graph we decide that certain property assignments in the setup section were not executed enough times for us to gather type feedback, so we insert a unconditional deoptimization instruction there;
- compiler transitively propagates deoptimization mark through the dominators tree, because he thinks that the code dominated by an unconditional deoptimization will never be executed;
- LICM is disabled for the parts of the graph that are marked as “deoptimizing”.
- execution enters resulting optimized version through OSR entry so it skips deoptimization instruction and proceeds to run loop that was not really all that optimized.
If I rewrite setup section to work around this bug by obstructing the control flow:
Benchmark.prototype.setup = function() {
  function mk1() {
    function ClosureColor(name) {
      // Have no choice but to add these methods to the instance
      this.getName = function () {
          return name;
      };
      this.setName = function (n) {
          name = n;
      };
    }
    return new ClosureColor('green');
  }

  function mk2() {
    function PrototypeColor(name) {
      this._name = name;
    }

    PrototypeColor.prototype.getName = function () {
      return this._name;
    };

    PrototypeColor.prototype.setName = function (n) {
      this._name = n;
    };

    return new PrototypeColor('green');
  }

  var closureColor = mk1();
  var prototypeColor = mk2();
};
then all checks (including a polymorphic one in the Prototype case) are hoisted from both loops leaving only stores and loads inside and as the result performance of both becomes the same:
∮ out/ia32.release/d8 test2.js
Closure x 603,675,310 ops/sec ±0.60% (67 runs sampled)
Prototype x 602,932,682 ops/sec ±0.84% (66 runs sampled)
Preliminary conclusions:
- Initial difference in performance between two test cases was caused by the invisible polymorphism that “leaked” from the pretest run.
- Overall performance was degraded due to LICM being disabled due to incorrect propagation of the “deoptimizes” marking through the graph.
Making test case more realistic
In the real world it is unlikely that application would create ClosureColor and PrototypeColor again and again. In most cases they will be created once and used to produce multiple objects.
function ClosureColor(name) {
  // Have no choice but to add these methods to the instance
  this.getName = function () {
      return name;
  };
  this.setName = function (n) {
      name = n;
  };
}

function PrototypeColor(name) {
  this._name = name;
}

PrototypeColor.prototype.getName = function () {
  return this._name;
};

PrototypeColor.prototype.setName = function (n) {
  this._name = n;
};

Benchmark.prototype.setup = function() {
  var closureColor = new ClosureColor('green');
  var prototypeColor = new PrototypeColor('green');
};
∮ out/ia32.release/d8 test3.js Closure x 66,993,950 ops/sec ±1.19% (65 runs sampled) Prototype x 605,601,154 ops/sec ±0.60% (67 runs sampled)
What just happened here? Nothing good. V8 usually tries to represent properties containing functions in a special way: put actual function values as constant functions on the hidden class. This allows them to perform as fast as methods in a more static language would. However right now this only works if you assign the very same function to the same property when producing a new object. ClosureColor assigns new closure each time which breaks V8’s approach. A bit more detailed explanation is available in my other post on closures.
Benchmarking microhorse
I would like to conclude by beating microbenchmarking horse again.
It is hard to write meaningful microbenchmarks.
It is even harder to interpret their results.
Please don’t do it.
This benchmark might look like it is comparing different class emulation approaches, but we saw that it does not and ultimately several months in the future it might simply become an empty loop benchmark once JavaScript VMs implement some sort of scalar replacement of aggregates
Scalar replacement of aggregates is an optimization that essentially promotes fields of aggregates into local variables and eliminates aggregates themselves. Classical scalar replacement relies on escape analysis to find objects do not escape current activation frame. However for speculatively specialized code it is usually impossible to find aggregates that do not escape in the strictest sense, because majority of allocated objects can escape through deoptimization exits. This issue is solved by treating deoptimization exits in a special way: optimizing common path with scalar replacement and performing aggregate rematerialization on deoptimizations. This optimization is known as allocation sinking because it sinks allocation of aggregates from the common path to uncommon (deoptimization) paths. More information can be found in LuaJIT wiki and the paper Allocation Removal by Partial Evaluation in a Tracing JIT published by PyPy authors.
In fact allocation sinking is not the only way compiler could render this microbenchmark useless. It could, for example, apply loop peeling: take first iteration out of the loop and start loop on the second iteration. Peeling would turn benchmarking code into something like this (after inlining):
function (N) {
  // ...
  if (0 < N) {
    var name = prototypeColor._name;
    prototypeColor._name = 'blue';
    for (var i = 1; i < N; i++) {
      var name = prototypeColor._name;
      prototypeColor._name = 'blue';
    }
  }
  // ...
}
Then compiler would follow with a round of store-to-load forwarding and redundant store elimination making the loop empty, as it can easily prove that prototypeColor._name contains 'blue' at the very start of the loop.