Compilers are not magical beasts. They are steampunk machines grinding your perfectly structured source into incomprehensible mess of native code. The better the compiler - the finer the grind and stronger our performance espresso. What’s not to like?
When however something clogs compiler’s pipes, we find ourselves staring at square meters of intermediate representation printouts and deoptimization complaints, desperately trying to ungrind fine powder into meaningful JavaScript beans.
If you ever had to look at V8’s IR you probably know that it dumps it out in form
that C1Visualizer, visualization tool created for C1 HotSpot compiler, can digest. It makes exploration of hydrogen.cfg much more comfortable but it does not make you smile.
So one sleepless night back in 2011 I became tired of not smiling and hacked together a bunch of HTML and JavaScript that survived two years, multiple rewrites (one of them turning code base into Dart). Now I would like to share this code with everybody who by stroke of fate has to look at IR and native code produced by V8 and Dart VM’s optimizing compilers.
Disclaimer
I wrote the tool for my own use, so I put little effort into thinking about UX or designing a UI. Frankly speaking designing UI is harder than writing a compiler. If you start using IRHydra and get ideas how to improve things don’t hesitate to send me comments, issues and patches.
IRHydra is extracting information from the dumps that were not necessarily intended to be machine readable. Thus currently it can misinterpret information or loose some of it. Take it with a grain of salt.
For me the most important features of this tools are its universal availability (no need to install anything just browse to the page) and the fact that I can easily extend it to do my bidding if I need to perform some highly custom highlighting over IR.
How does it work?
Quite simply: you take compilation artifacts produced by V8 or Dart VM and view them in the browser. IRHydra does not have any server component, it uses FileReader API so your files are not uploaded anywhere they are parsed and displayed locally.
The way to obtain compilation artifacts depends on your platform. For example when using node.js you can do:
node --trace-hydrogen \
     --trace-deopt    \
     --code-comments  \
     --print-opt-code \
     benchmark/http_simple.js > code.asm
Now hydrogen.cfg will contain intermediate representation generated by V8’s optimizing compiler and code.asm will contain all information dumped by V8 to standard output (disassembly and deoptimizations).
By default release version of V8 is built with disassembler disabled. To enable it you might have to reconfigure and rebuild your node:
GYP_DEFINES="v8_enable_disassembler=1 v8_object_print=1" ./configure
make
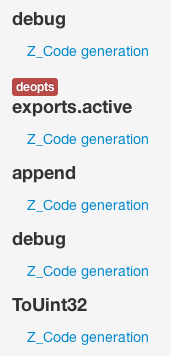
Once you feed these files into IRHydra it’ll show you a list of optimized function and place a red marker near those that deoptimized. IRHydra is using names to match deoptimizations to compiled functions so it might mismatch some (especially if you have multiple functions with the same name).
Selecting function’s compilation phase will display generated IR and control flow graph on the right pane. Some important features of the IR viewer:
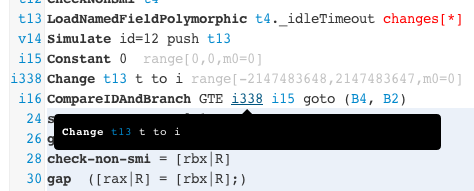
Cross-references
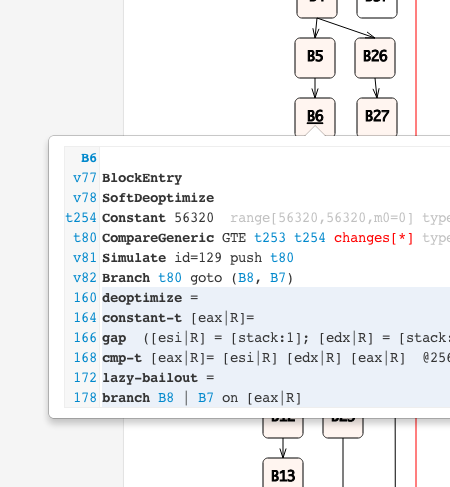
IR is cross-referenced: hovering over SSA variable name or block name will display referenced instruction or the whole block.
Deoptimizations
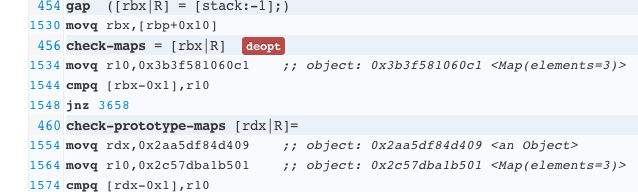
If possible deoptimizations are matched to the IR instructions where they actually occurred. This instructions are annotated with deopt marker.
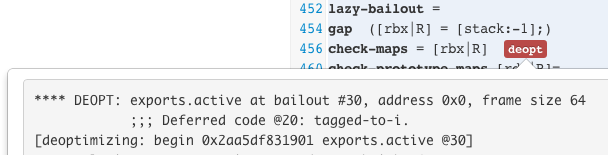
On ia32 it is usually possible to match deoptimization to the lithium instruction just using information from the --trace-deopt --code-comments output. However as one can notice from the picture above on x64 architecture this output lies and IRHydra requires either hydrogen.cfg produced by V8 not older than 3.17 or full optimized code disassembly to perform matching.
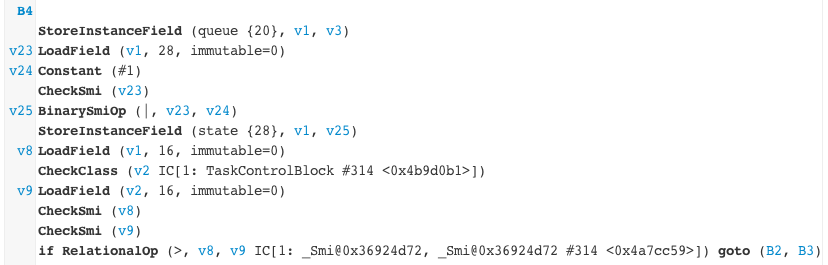
Additionally viewer supports attaching descriptions to HIR and LIR instructions to help someone not intimately familiar with V8 to understand the reason behind the deoptimization.
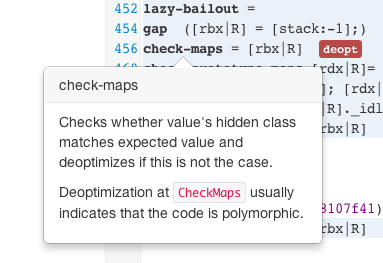
Only a handful of instructions is annotated right now but don’t hesitate to file bugs against those that are not. If you are familiar with V8 IR you can even send me patches against descriptions.html.
Disassembly
When available the disassembly can be spliced into the IR.
In future I plan to improve disassembly view by providing better highlighting for it and implementing some tools to highlight “data-flow” between registers.
Control flow graph
Finally the control flow graph is available in all its beauty. It is connected to the main IR view for easy navigation and overview. Loop blocks are dyed red from a Brewer palette: color becomes more intense as loop nesting depth increases.
Graph layout itself is performed by a part of Draw2d library semi-automatically translated from Java to Dart. Translation was done by a very early version of the java2dart tool and might have introduced some bugs, but majority of graphs I tried it on seem to look fine or almost fine :-)
Using IRHydra with Dart VM
As indicated above both V8 and Dart VM are supported. In fact IRHydra is even more useful for Dart VM because it does not output anything like hydrogen.cfg and you are bound to explore IR in your favorite text editor.
To obtain compilation artifacts you need to run Dart VM in the following way:
dart --print-flow-graph-optimized \
     --disassemble-optimized      \
     --code-comments              \
     benchmark.dart > code.asm
All information will be dumped to standard output. If you load code.asm into IRHydra you’ll be able to explore it in the same way (including disassembly and graph views) as you can explore V8 IRs:
The only feature not supported for Dart VM is deoptimization markers because I did not yet have any need for it.
Want to discuss
contents of this post? Drop me a mail [email protected] or find me on
Mastodon,
X or Bluesky.